Fig. 6.
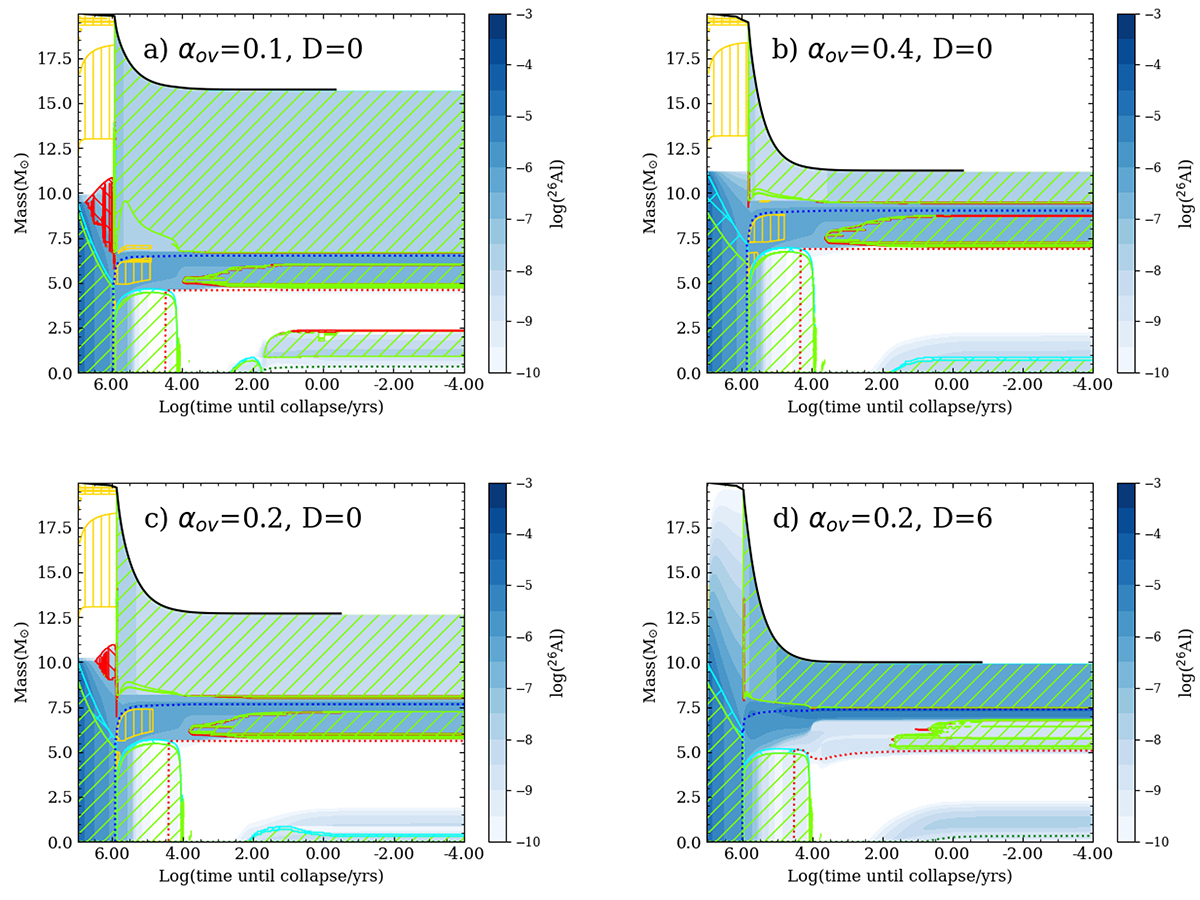
Download original image
Kippenhahn diagrams for the models with αov = 0.10, αov = 0.2, and αov = 0.4, all with log(Denv/cm2 s−1) = 0 (panels a, c, and b, respectively), as well as αov = 0.2 and log(Denv/cm2 s−1) = 6 (panel d). The solid black line is the stellar mass. The green hatched areas correspond to areas of convection, the cyan hatched areas to CBM, the red hatched areas to semi-convection, and the yellow hatched areas to thermohaline mixing. The blue dotted line indicates the hydrogen-depleted core. The red and green dotted lines indicate the helium- and carbon-depleted cores, respectively. The colour scale shows the 26Al mass fraction as a function of the mass coordinate and time.
Current usage metrics show cumulative count of Article Views (full-text article views including HTML views, PDF and ePub downloads, according to the available data) and Abstracts Views on Vision4Press platform.
Data correspond to usage on the plateform after 2015. The current usage metrics is available 48-96 hours after online publication and is updated daily on week days.
Initial download of the metrics may take a while.