Fig. 4.
Download original image
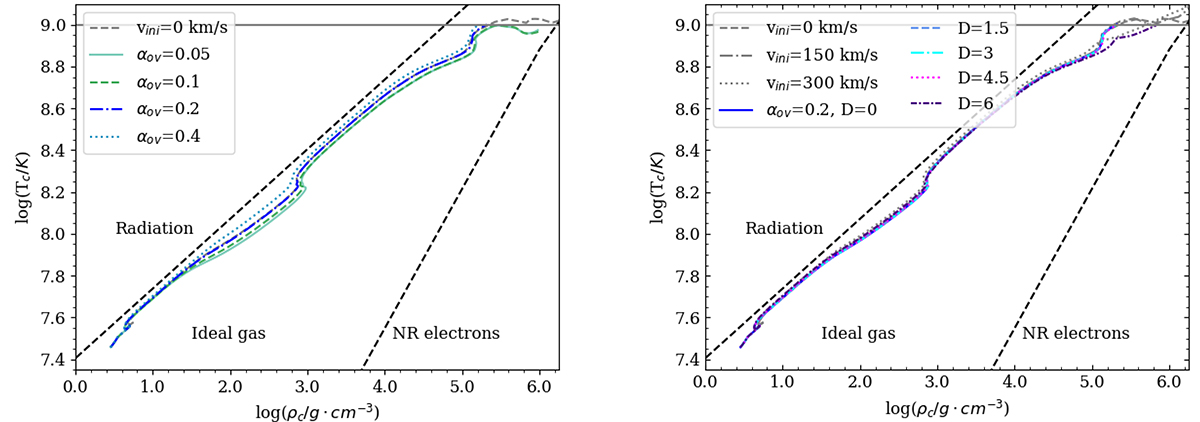
ρc–Tc diagram for the 20 M⊙ models with different values for αov and no extra envelope mixing (log(Denv/cm2 s−1) = 0) (left panel). The right panel shows the same for αov = 0.2 and the different values for the envelope mixing, where D = log(Denv/cm2 s−1). In the left panel, the grey line shows the non-rotating model from Brinkman et al. (2021) with αov = 0.2. In the right panel, the rotating models with initial rotational velocities for 150 and 300 km/s are added as a comparison for the different treatment of envelope mixing. The blue line is the same model in both panels. The black dashed lines give a rough indication of the equations of state, that is, radiative, ideal gas, and non-relativistic electron pressure (NR electrons). The grey horizontal lines indicate a central temperature of Tc = 109.
Current usage metrics show cumulative count of Article Views (full-text article views including HTML views, PDF and ePub downloads, according to the available data) and Abstracts Views on Vision4Press platform.
Data correspond to usage on the plateform after 2015. The current usage metrics is available 48-96 hours after online publication and is updated daily on week days.
Initial download of the metrics may take a while.