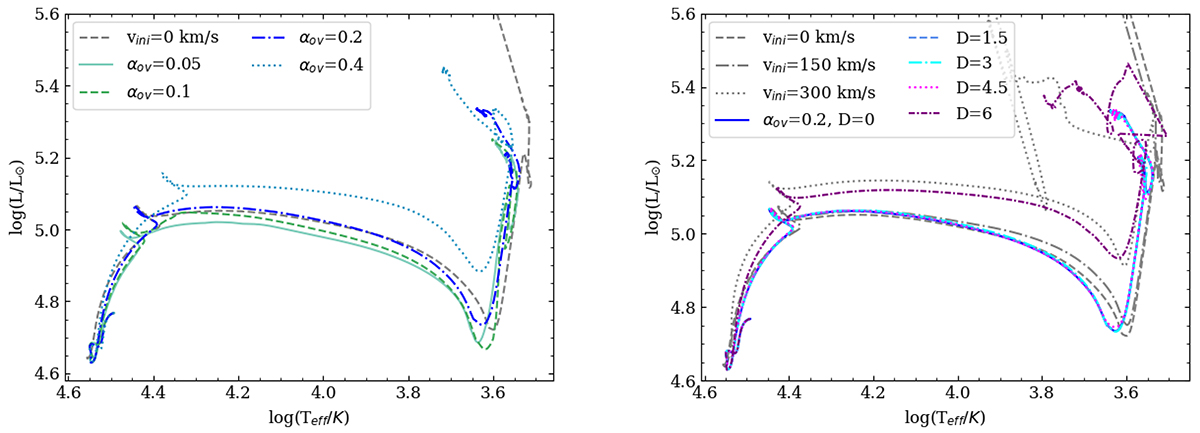
Fig. 2.
Download original image
Tracks in the Hertzsprung-Russel diagram for the different values of αov and no extra envelope mixing (log(Denv/cm2 s−1) = 0) (left panel) and for the different values of log(Denv/cm2 s−1) for a fixed value of αov = 0.2 (right panel). The different colours indicate the different values for the CBM and the envelope mixing. In the left panel, the grey line shows the non-rotating model from Brinkman et al. (2021) with αov = 0.2. In the right panel, the rotating models with initial rotational velocities for 150 and 300 km/s are added as a comparison for the different treatment of envelope mixing. The blue line is the same model in both panels. Only the model with log(Denv/cm2 s−1) = 6 shows a significant difference from the other models with the same amount of CBM, while even a moderately different αov produces a discernible shift.
Current usage metrics show cumulative count of Article Views (full-text article views including HTML views, PDF and ePub downloads, according to the available data) and Abstracts Views on Vision4Press platform.
Data correspond to usage on the plateform after 2015. The current usage metrics is available 48-96 hours after online publication and is updated daily on week days.
Initial download of the metrics may take a while.