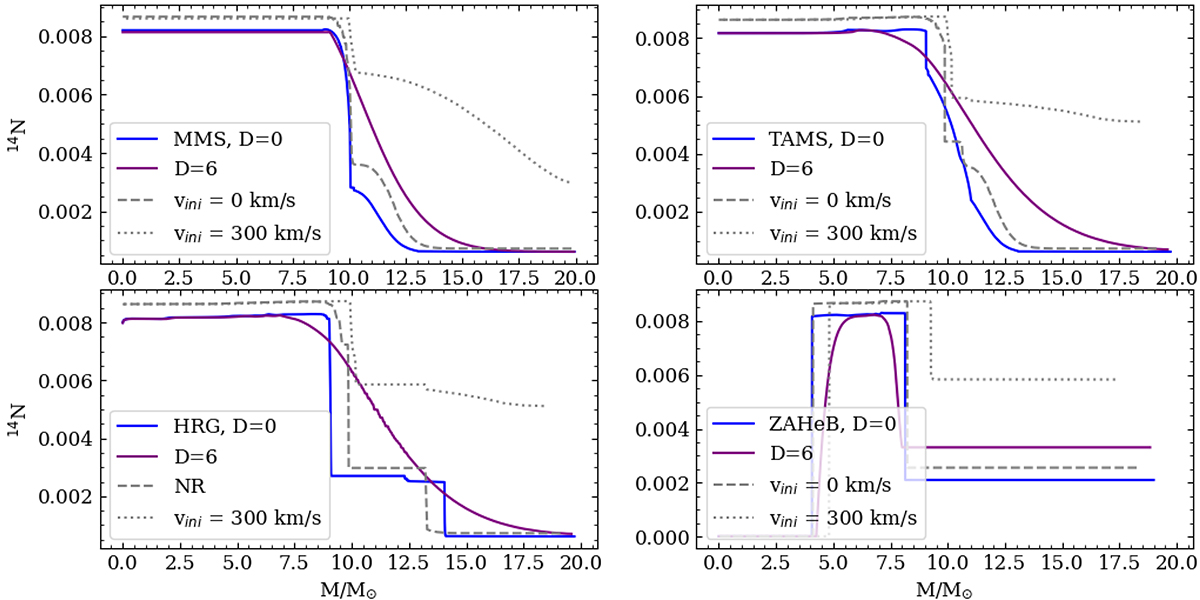
Fig. 14.
Download original image
14N abundance profiles at four different phases of the evolution of the models with αov = 0.2 and log(Denv/cm2 s−1) = 0 (blue) and 6 (purple). The top left panel shows the profiles halfway the main sequence (MMS), the top right at the end of the main sequence (TAMS), the bottom left at the beginning of the Hertzsprung gap (HRG), and the bottom right at the onset of helium burning (ZAHeB). The grey lines a (dashed for 0 km/s and dotted for 300 km/s) are from Brinkman (2022).
Current usage metrics show cumulative count of Article Views (full-text article views including HTML views, PDF and ePub downloads, according to the available data) and Abstracts Views on Vision4Press platform.
Data correspond to usage on the plateform after 2015. The current usage metrics is available 48-96 hours after online publication and is updated daily on week days.
Initial download of the metrics may take a while.