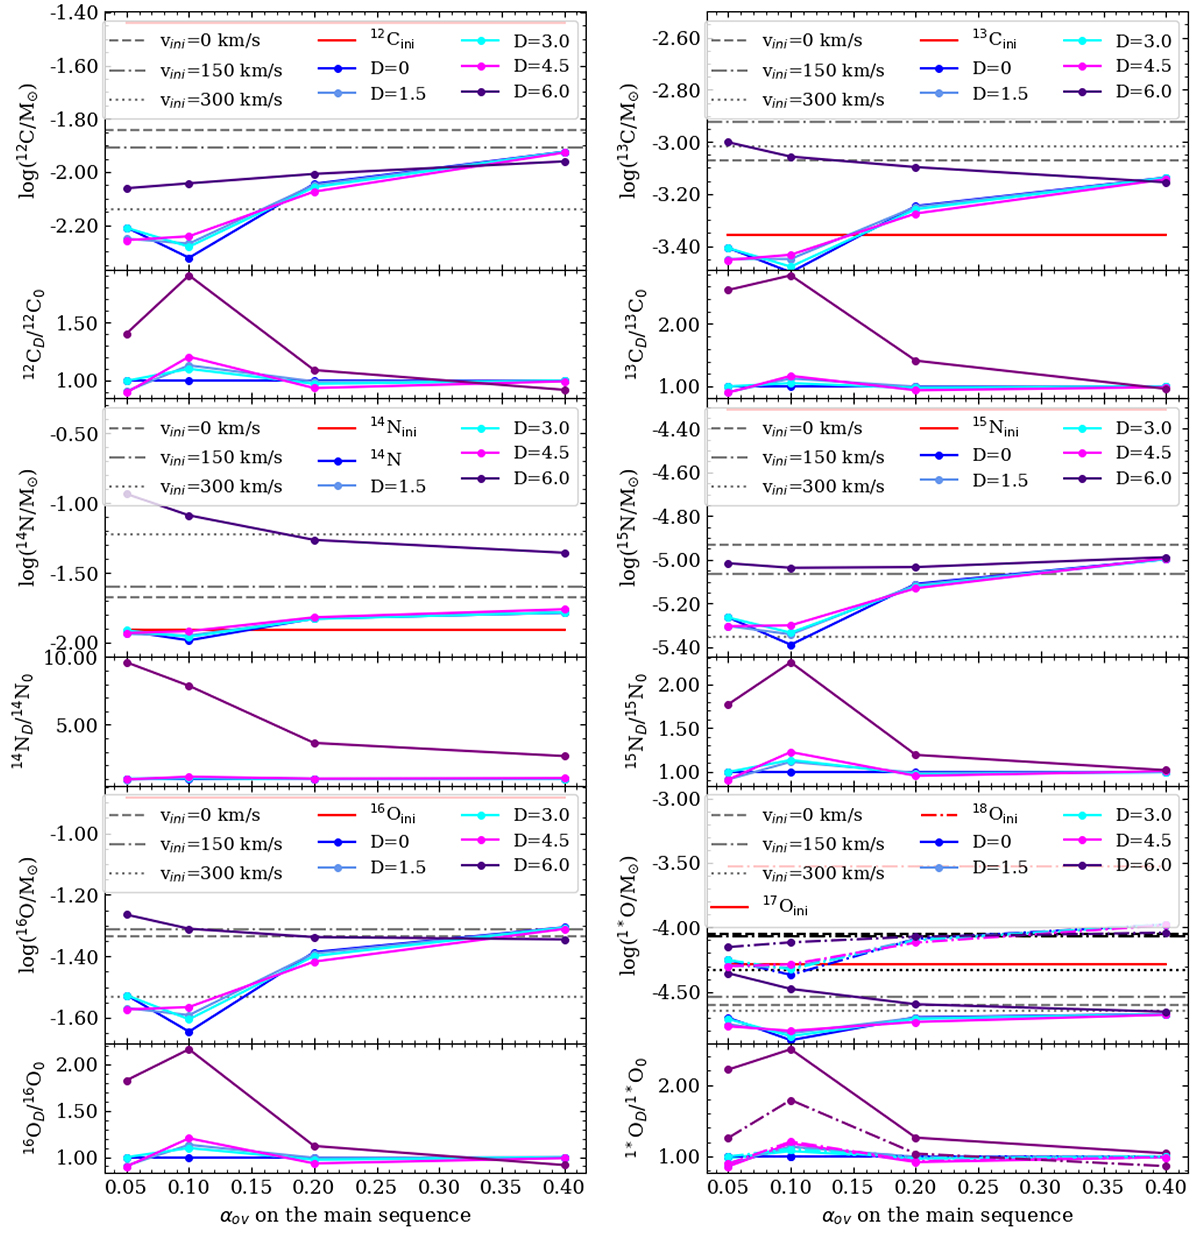
Fig. 12.
Download original image
Yields for the main isotopes of the CNO cycle for the different values of αov and log(Denv/cm2 s−1) (dots connected by lines). The horizontal lines indicate the yields of 20 M⊙ models (dashed, dashed-dotted, and dotted lines) with different rotational velocities (0, 150, and 300 km/s, from Brinkman (2022)). The isotopes are 12C, 13C, 14N, 15N, 16O, and in the last panel 17O (solid lines) and 18O (dash-dotted lines). In this panel, the grey horizontal lines are for 17O and the black horizontal lines are for 18O. The lower panels show the ratio between the yield of the reference models (log(Denv/cm2 s−1) = 0) and the models with the other values for log(Denv/cm2 s−1).
Current usage metrics show cumulative count of Article Views (full-text article views including HTML views, PDF and ePub downloads, according to the available data) and Abstracts Views on Vision4Press platform.
Data correspond to usage on the plateform after 2015. The current usage metrics is available 48-96 hours after online publication and is updated daily on week days.
Initial download of the metrics may take a while.