Open Access
Fig. 4.
Download original image
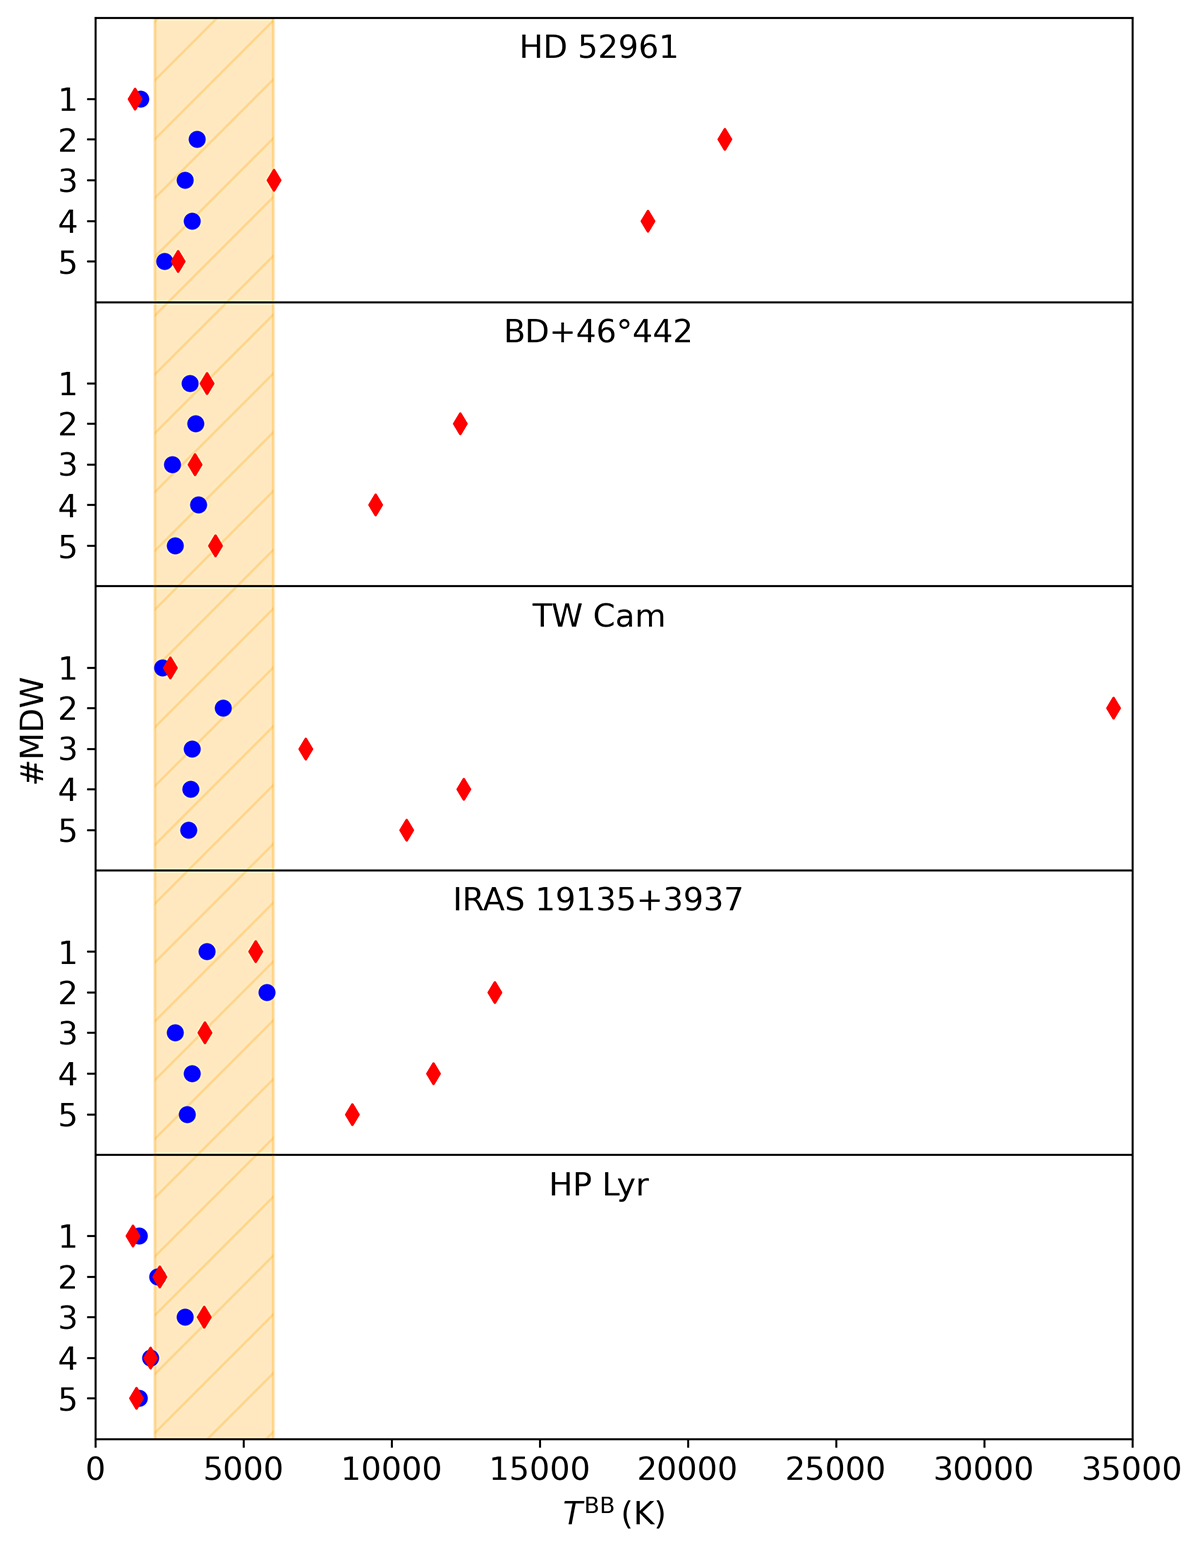
Blackbody temperatures derived from the accretion disc’s spectral slope, considering either the full spectrum (![]() , red diamonds), or only the H band (
, red diamonds), or only the H band (![]() , blue dots). The orange shaded area denotes the ±1σ region of the Tdisc estimate for IRAS 08544−4431 by Hillen et al. (2016), around which the
, blue dots). The orange shaded area denotes the ±1σ region of the Tdisc estimate for IRAS 08544−4431 by Hillen et al. (2016), around which the ![]() values cluster.
values cluster.
Current usage metrics show cumulative count of Article Views (full-text article views including HTML views, PDF and ePub downloads, according to the available data) and Abstracts Views on Vision4Press platform.
Data correspond to usage on the plateform after 2015. The current usage metrics is available 48-96 hours after online publication and is updated daily on week days.
Initial download of the metrics may take a while.