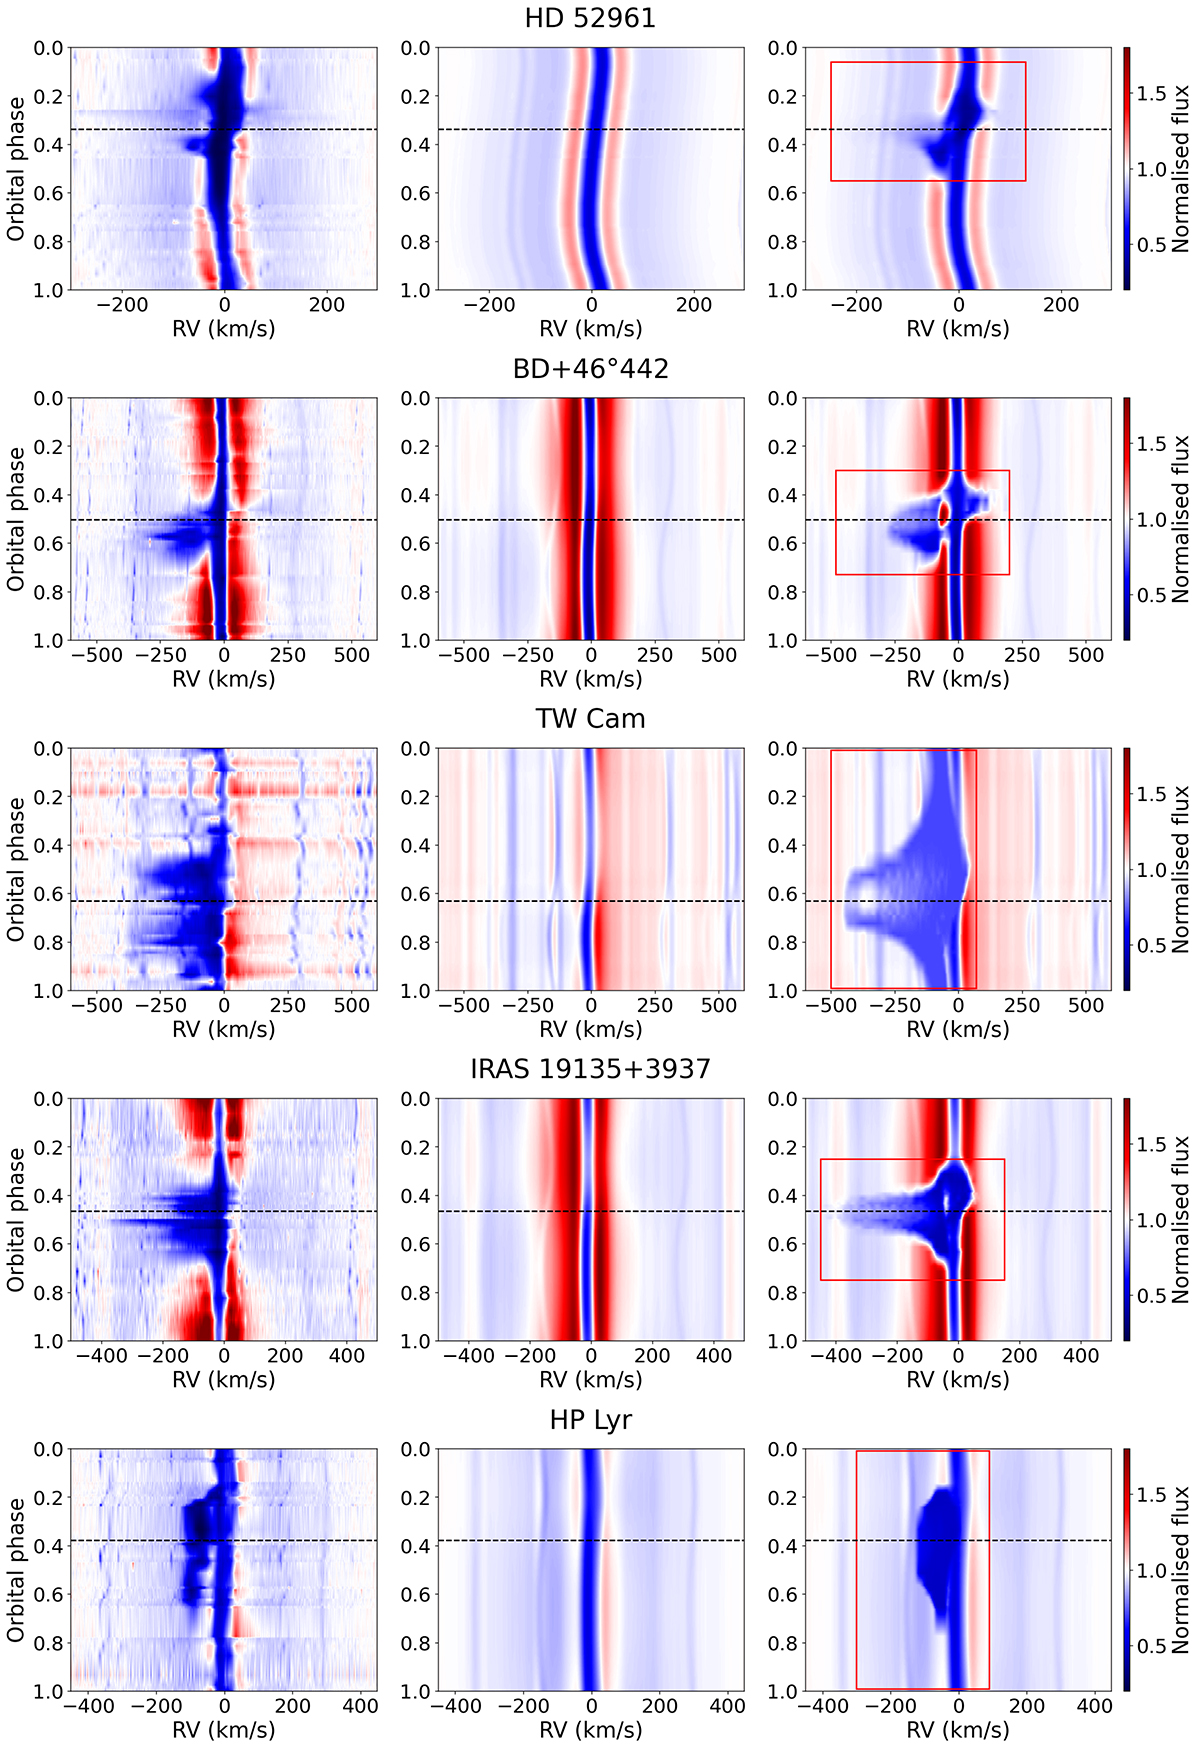
Fig. 1.
Download original image
Dynamic spectra (see explanation in Sect. 3.1) for the target systems’ Hα lines. Left: observed spectral time-series after spectra selection. Middle: background spectrum used as input for the RT module. Right: best fitting disc wind model (parameters summarised in Table 4). A black dashed line marks superior conjunction, while a red selection box denotes the region used for the calculation of ![]() .
.
Current usage metrics show cumulative count of Article Views (full-text article views including HTML views, PDF and ePub downloads, according to the available data) and Abstracts Views on Vision4Press platform.
Data correspond to usage on the plateform after 2015. The current usage metrics is available 48-96 hours after online publication and is updated daily on week days.
Initial download of the metrics may take a while.