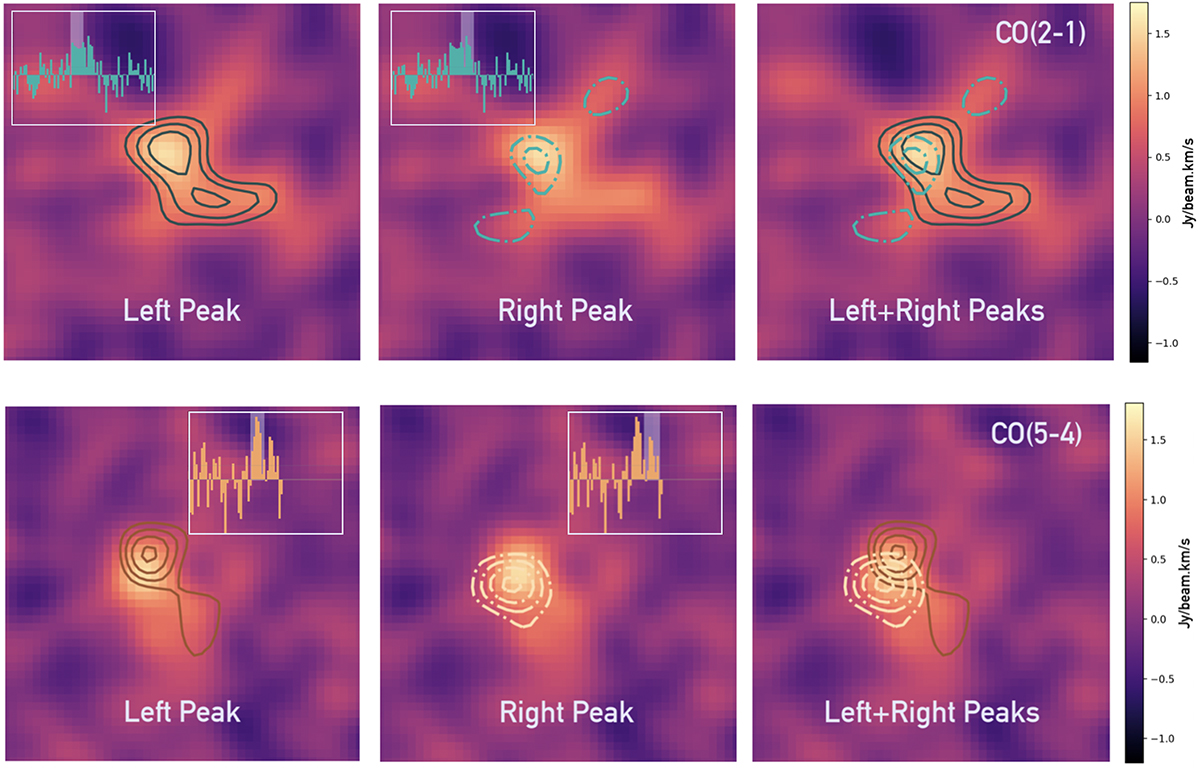
Fig. 5.
Download original image
Contours of the CO(2–1) (top row) and CO(5–4) (bottom row) intensity maps when integrating around the negative velocity peak (left column, solid lines) or the right peak (middle column, dash-dotted lines) of the emissions. The right column shows the two peaks overlaid. The negative and positive velocity peaks correspond to −575 km/s, −50 km/s, and −50 km/s to −475 km/s, respectively, for the CO(2–1) and CO(5–4) emissions. The contours start at 3σ and increase with an indent of 1σ. The background image in the top row (bottom row) is the CO(2–1) (CO(5–4)) emission when integrating the entire peak, as shown in the left (right) panel of Figure 2. The inset shows the spectrum, and the channels we used in the imaging are highlighted with the grey shaded area.
Current usage metrics show cumulative count of Article Views (full-text article views including HTML views, PDF and ePub downloads, according to the available data) and Abstracts Views on Vision4Press platform.
Data correspond to usage on the plateform after 2015. The current usage metrics is available 48-96 hours after online publication and is updated daily on week days.
Initial download of the metrics may take a while.