Fig. 9
Download original image
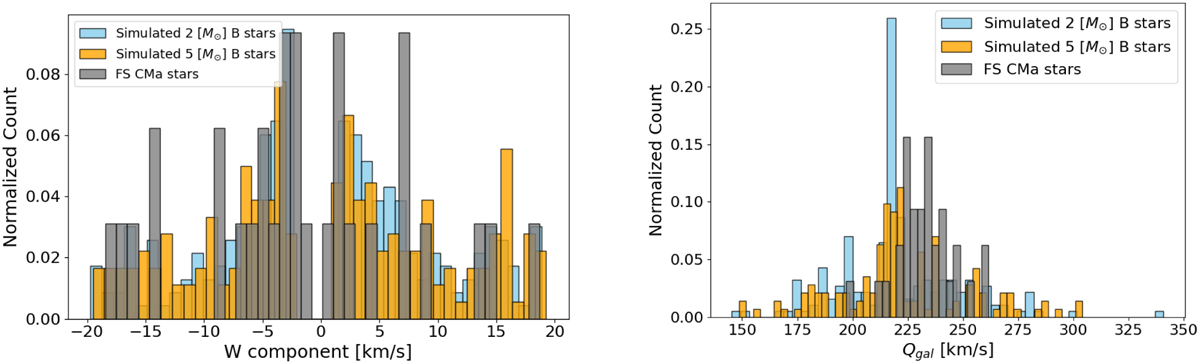
Comparison of the simulated mergers with observed FS CMa stars. Left panel: W component of the space velocity. Due to the low number of extremely fast FS CMa stars, the displayed range of velocities is restricted from −20 to −2 km/s and 2 to 20 km/s (the full distribution is shown in Fig. A.1). The region around a zero value for the W velocity has also been removed. Even if the majority of simulated mergers occupies this region, it is impossible to compare them with observations due to high extinction in the galactic plane. Right panel: same sample of mergers, plotted in space velocity with respect to the galactic centre.
Current usage metrics show cumulative count of Article Views (full-text article views including HTML views, PDF and ePub downloads, according to the available data) and Abstracts Views on Vision4Press platform.
Data correspond to usage on the plateform after 2015. The current usage metrics is available 48-96 hours after online publication and is updated daily on week days.
Initial download of the metrics may take a while.