Fig. 8
Download original image
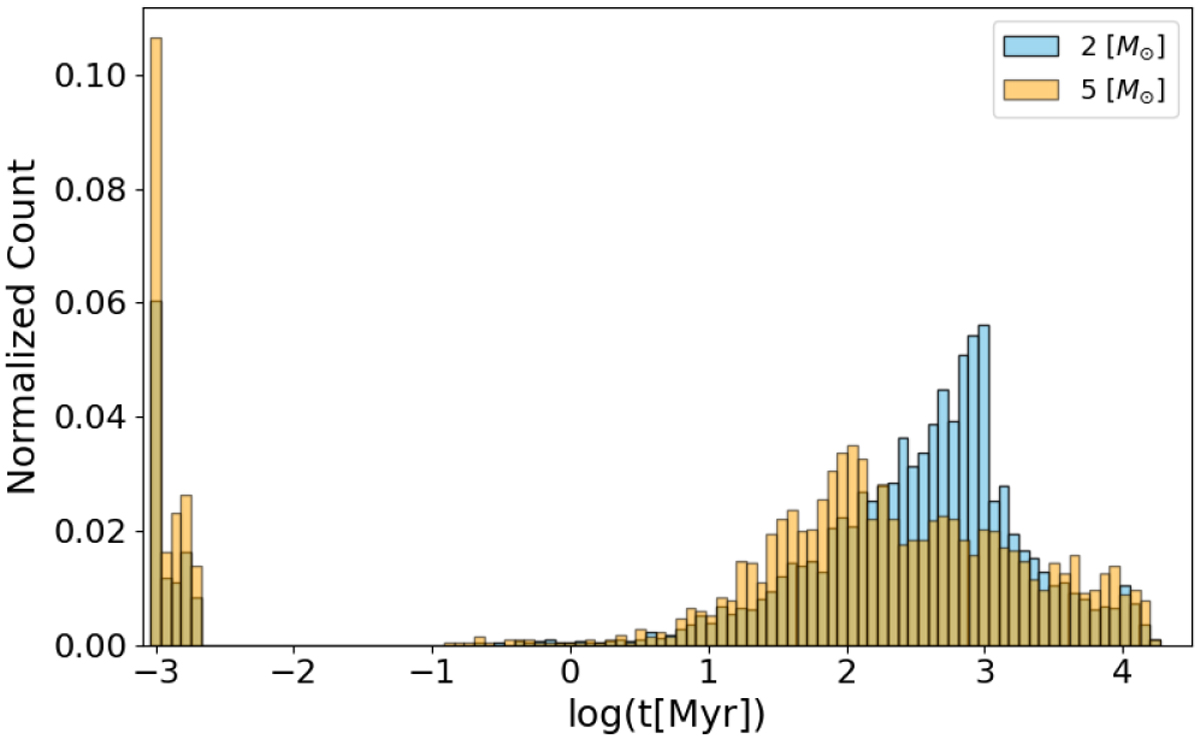
Histogram of the time of occurrence of individual merger events. We can clearly see the early mergers resulting from the pre-main-sequence eigenevolution process. All these early mergers occurred within the first 2000 years of the simulations. The second broad maximum in the histogram represents all the merger events that happened after the first 100 Myr.
Current usage metrics show cumulative count of Article Views (full-text article views including HTML views, PDF and ePub downloads, according to the available data) and Abstracts Views on Vision4Press platform.
Data correspond to usage on the plateform after 2015. The current usage metrics is available 48-96 hours after online publication and is updated daily on week days.
Initial download of the metrics may take a while.