Open Access
Fig. 6
Download original image
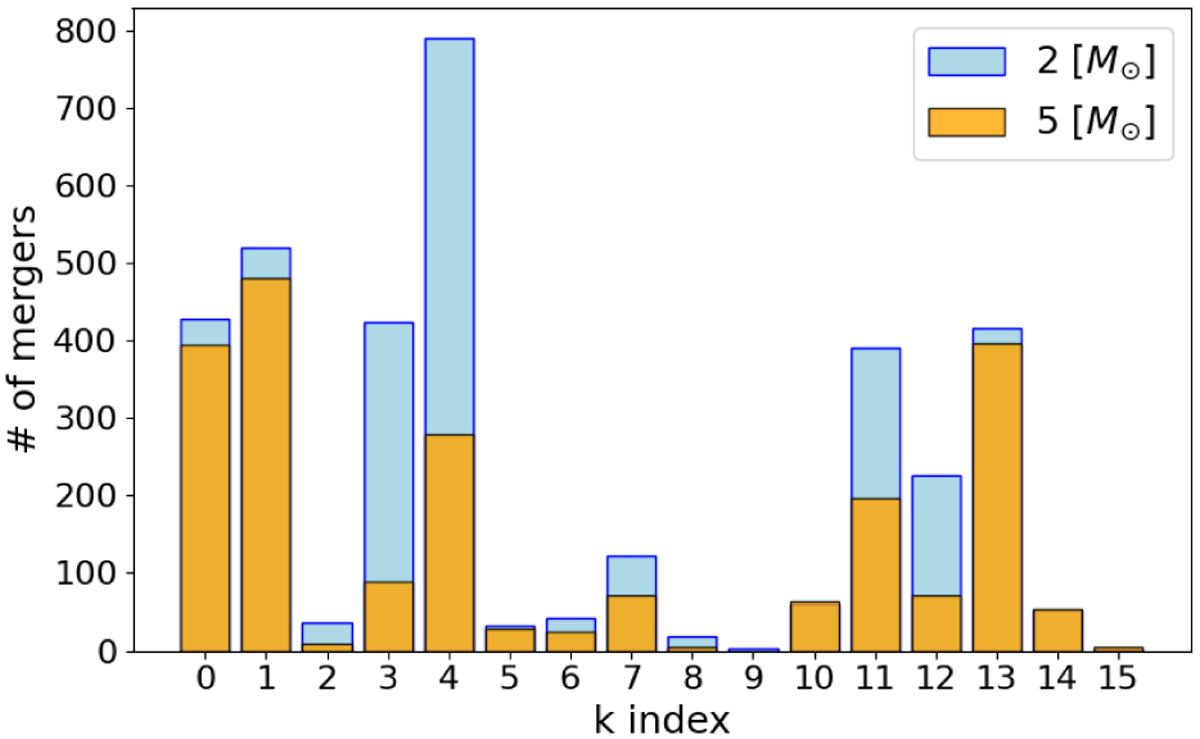
Bar chart of the k index of the merger products. The entire ensemble of individual stars accounts for 3558 mergers for the simulations with mthr = 2 M⊙ (in blue) and 2167 mergers in case of the simulations with mthr = 5 M⊙ (in orange). An explanation of the k index values can be found in Table 4.
Current usage metrics show cumulative count of Article Views (full-text article views including HTML views, PDF and ePub downloads, according to the available data) and Abstracts Views on Vision4Press platform.
Data correspond to usage on the plateform after 2015. The current usage metrics is available 48-96 hours after online publication and is updated daily on week days.
Initial download of the metrics may take a while.