Fig. 4
Download original image
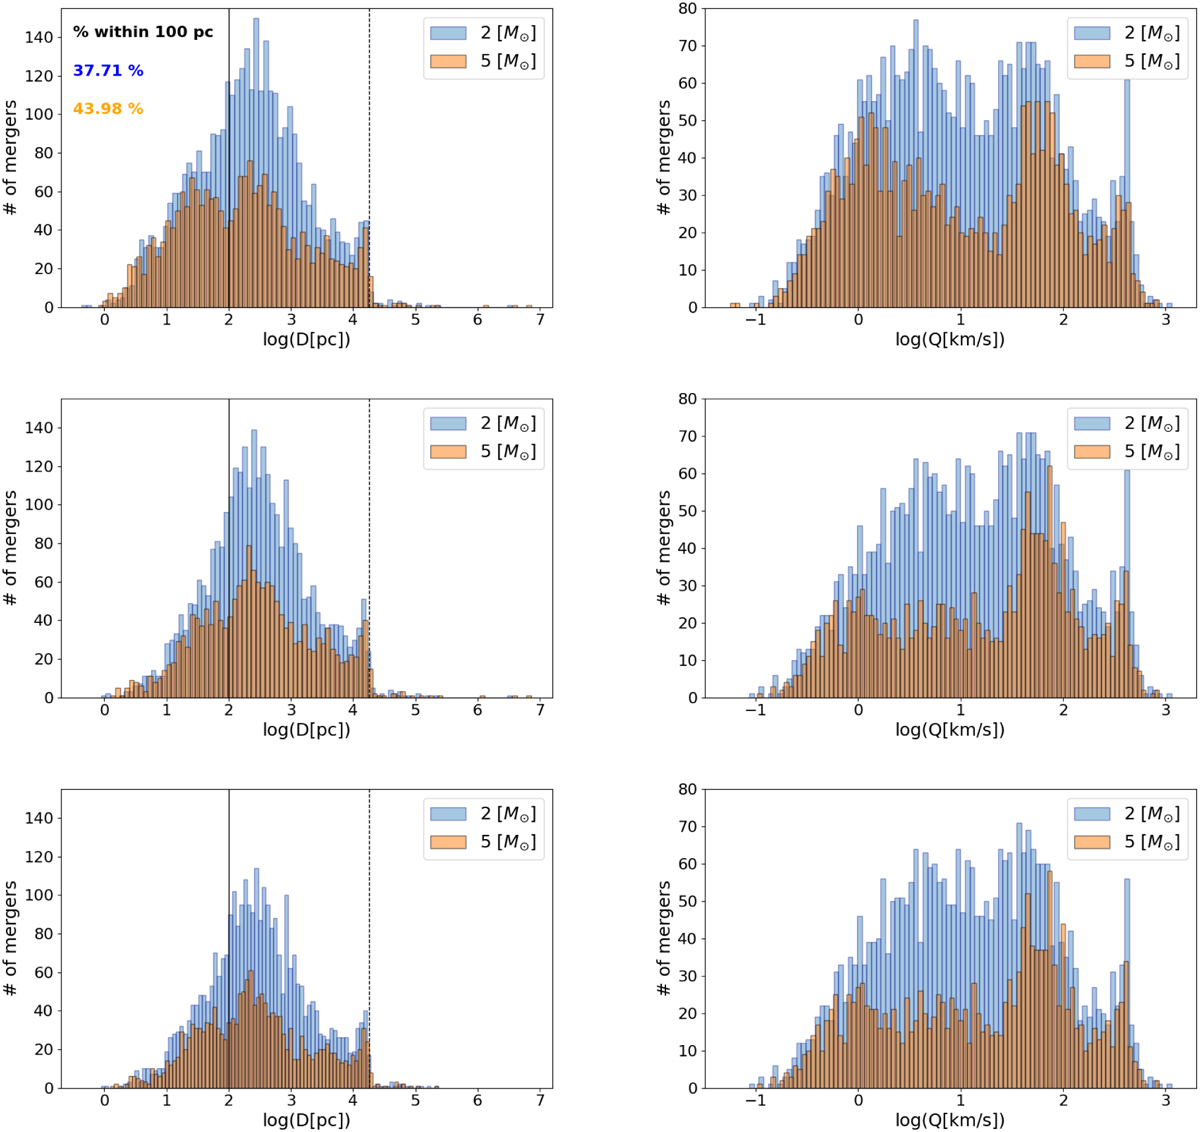
Effect of the pre-main-sequence mergers and main-sequence mergers on the total distribution of mergers. Left column: histogram of the distances of mergers at the time of the merger event. Right column: space velocity, Q, of mergers, relative to the centre of mass of the cluster, at the time of the merger event. The upper panels show the distribution for all mergers, and the middle panels the distribution in which the contribution of the mergers during the pre-main-sequence eigenevolution was removed. The properties of mergers created after the main-sequence are shown in the bottom panels (no early mergers and no mergers before CE). The notation is the same as in Fig. 3.
Current usage metrics show cumulative count of Article Views (full-text article views including HTML views, PDF and ePub downloads, according to the available data) and Abstracts Views on Vision4Press platform.
Data correspond to usage on the plateform after 2015. The current usage metrics is available 48-96 hours after online publication and is updated daily on week days.
Initial download of the metrics may take a while.