Fig. 3
Download original image
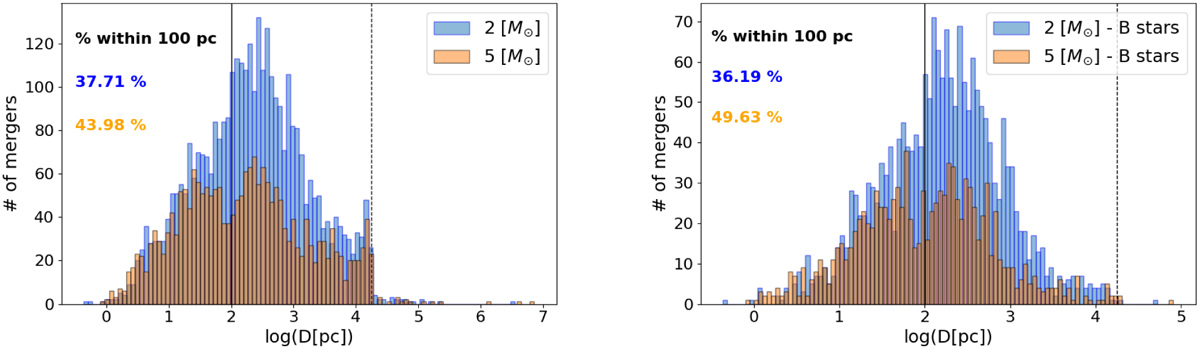
Left panel: histogram of the distance at the time of merger for the two sets of simulations of all spectral types. The results for a threshold period mass of 2 M⊙ and 5 M⊙ are depicted in blue and orange, respectively. The black line indicates a 100 pc distance. Percentages show the fraction of mergers that occurred within a 100 pc distance. The dashed black line highlights the cut-off distance at approximately 4.25 on the logarithmic scale. Right panel: distance histogram for B-type stars only. Colour coding corresponds to that of the left panel.
Current usage metrics show cumulative count of Article Views (full-text article views including HTML views, PDF and ePub downloads, according to the available data) and Abstracts Views on Vision4Press platform.
Data correspond to usage on the plateform after 2015. The current usage metrics is available 48-96 hours after online publication and is updated daily on week days.
Initial download of the metrics may take a while.