Open Access
Fig. A.1
Download original image
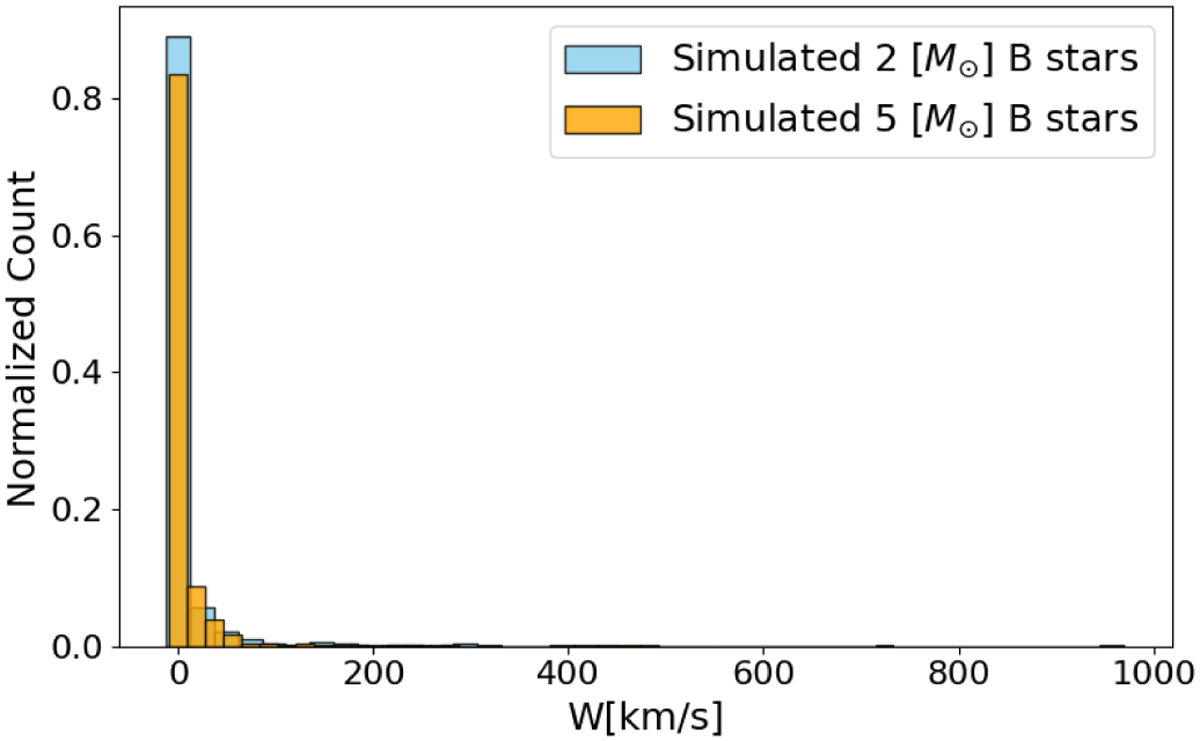
W component of the space velocity relative to the centre of mass of the cluster. Due to the symmetry of the calculated distribution, we show only its positive part of the distribution on the right panel. Both distributions (the 2 M⊙ and 5 M⊙) are normalised in these plots.
Current usage metrics show cumulative count of Article Views (full-text article views including HTML views, PDF and ePub downloads, according to the available data) and Abstracts Views on Vision4Press platform.
Data correspond to usage on the plateform after 2015. The current usage metrics is available 48-96 hours after online publication and is updated daily on week days.
Initial download of the metrics may take a while.