Fig. 10
Download original image
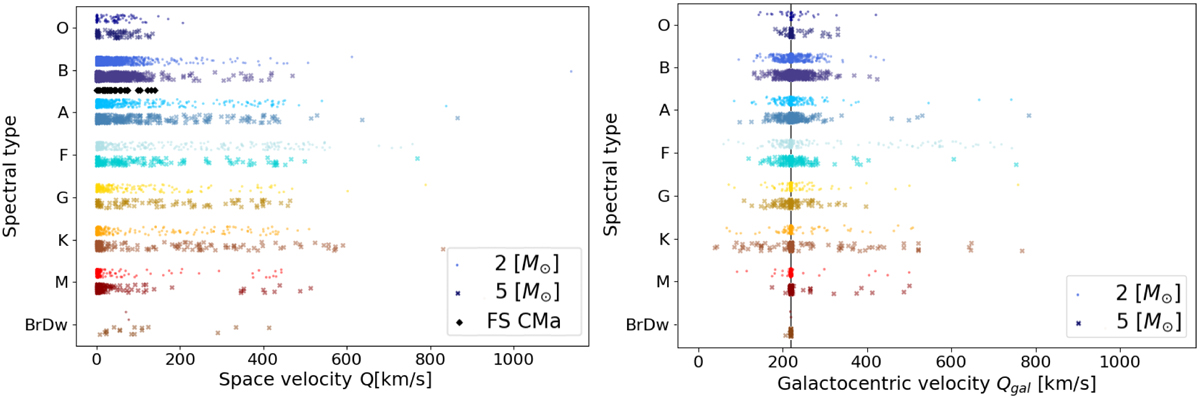
Comparison of space velocities of individual spectral types of mergers. The lighter coloured dots represent the simulations of a 2 M⊙ threshold period mass and the darker coloured crosses represent the 5 M⊙ simulations. Left panel: space velocities with respect to the centre of mass of the parent cluster. Measured space velocities of the FS CMa stars in our sample are included in the plot under spectral type B (black diamonds). Right panel: comparison of Galactocentric space velocities of the simulated mergers. The circular velocity of the corresponding cluster is denoted by the vertical line at a velocity of 219.7 km/s. We can see that the less massive the post-mergers are, the further they spread out from their original cluster.
Current usage metrics show cumulative count of Article Views (full-text article views including HTML views, PDF and ePub downloads, according to the available data) and Abstracts Views on Vision4Press platform.
Data correspond to usage on the plateform after 2015. The current usage metrics is available 48-96 hours after online publication and is updated daily on week days.
Initial download of the metrics may take a while.