Fig. 1
Download original image
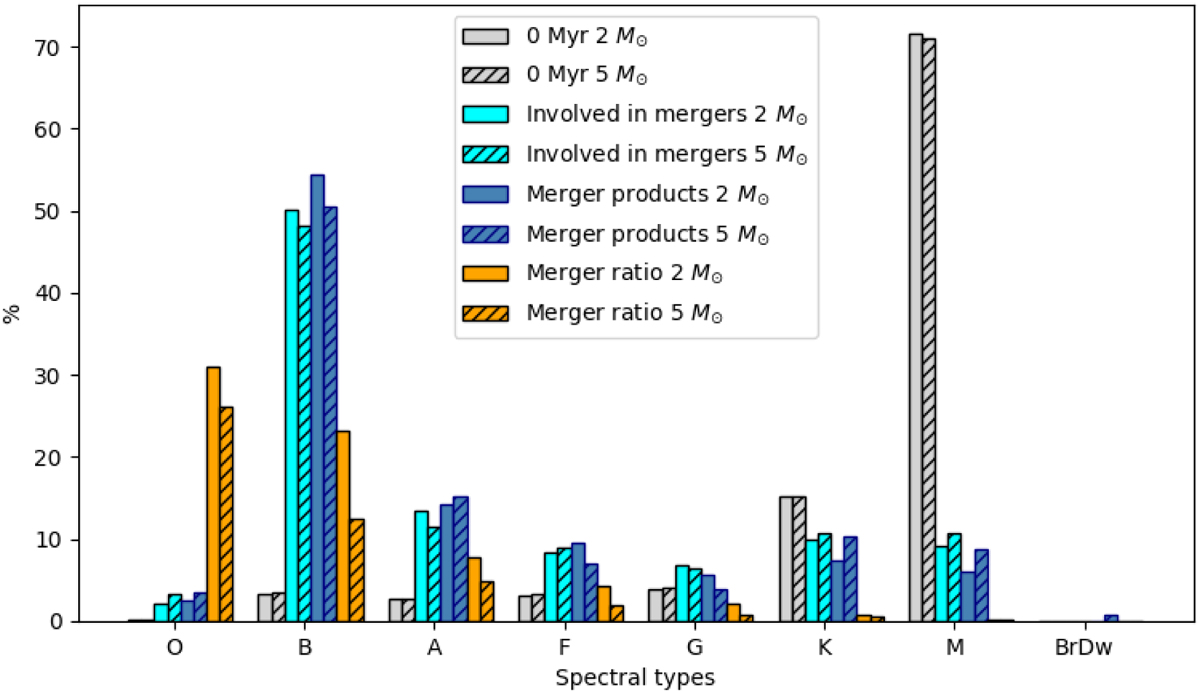
Bar chart representation of values in Table 3. The solid boxes represent the analysis of simulations with a threshold mass of 2 M⊙. The hatched boxes represent simulations with a threshold mass of 5 M⊙. The grey bars demonstrate all stars at a time of 0 Myr, the cyan colour stands for the initial spectral type distribution of stars that are involved in merger events, blue represents spectral types of the merger products, and the orange colour shows the ratio of mergers for each spectral type.
Current usage metrics show cumulative count of Article Views (full-text article views including HTML views, PDF and ePub downloads, according to the available data) and Abstracts Views on Vision4Press platform.
Data correspond to usage on the plateform after 2015. The current usage metrics is available 48-96 hours after online publication and is updated daily on week days.
Initial download of the metrics may take a while.