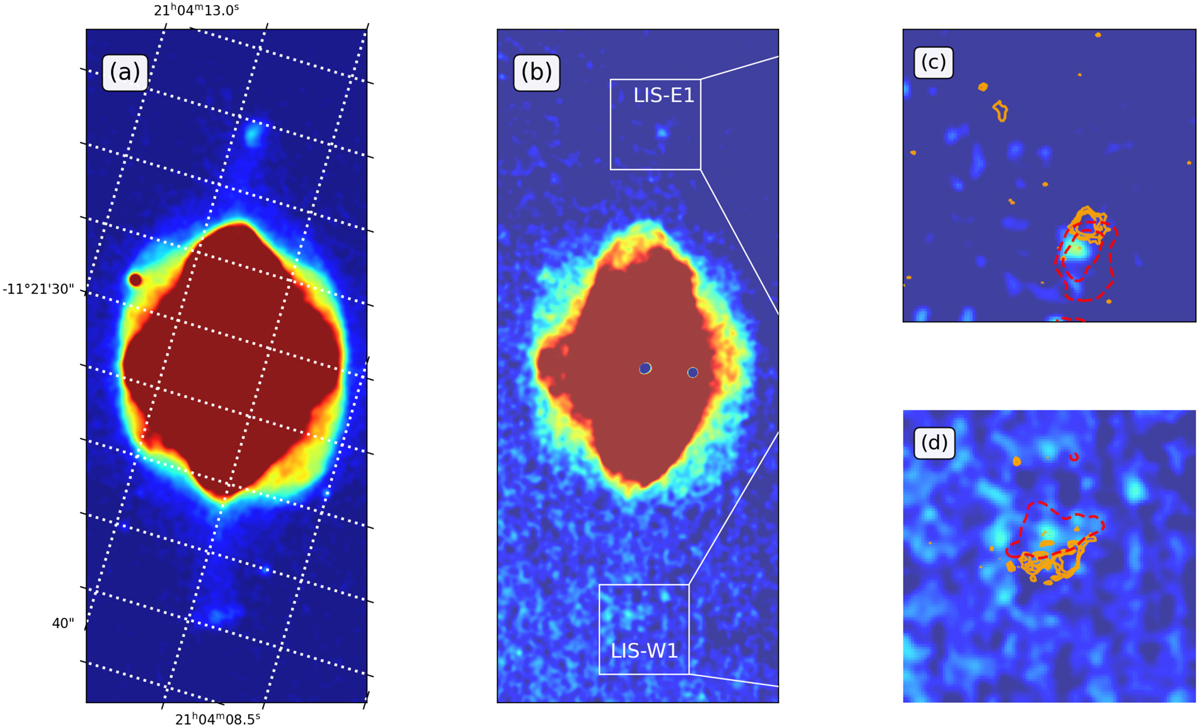
Fig. 1
Download original image
Gemini NIRI images of NGC 7009. Panel a: total [Fe II]+H I line image. Panel b: continuum-subtracted [Fe II]+H I line image. Panels c and d: zoom-in of the continuum-subtracted [Fe II]+H I image to the LIS-W1 and LIS-E1 overlaid by the H2 1−0 emission (orange contours) and Brγ emission (dashed red contours). Panel a is on logarithmic scale and panels b-d on a linear scale.
Current usage metrics show cumulative count of Article Views (full-text article views including HTML views, PDF and ePub downloads, according to the available data) and Abstracts Views on Vision4Press platform.
Data correspond to usage on the plateform after 2015. The current usage metrics is available 48-96 hours after online publication and is updated daily on week days.
Initial download of the metrics may take a while.