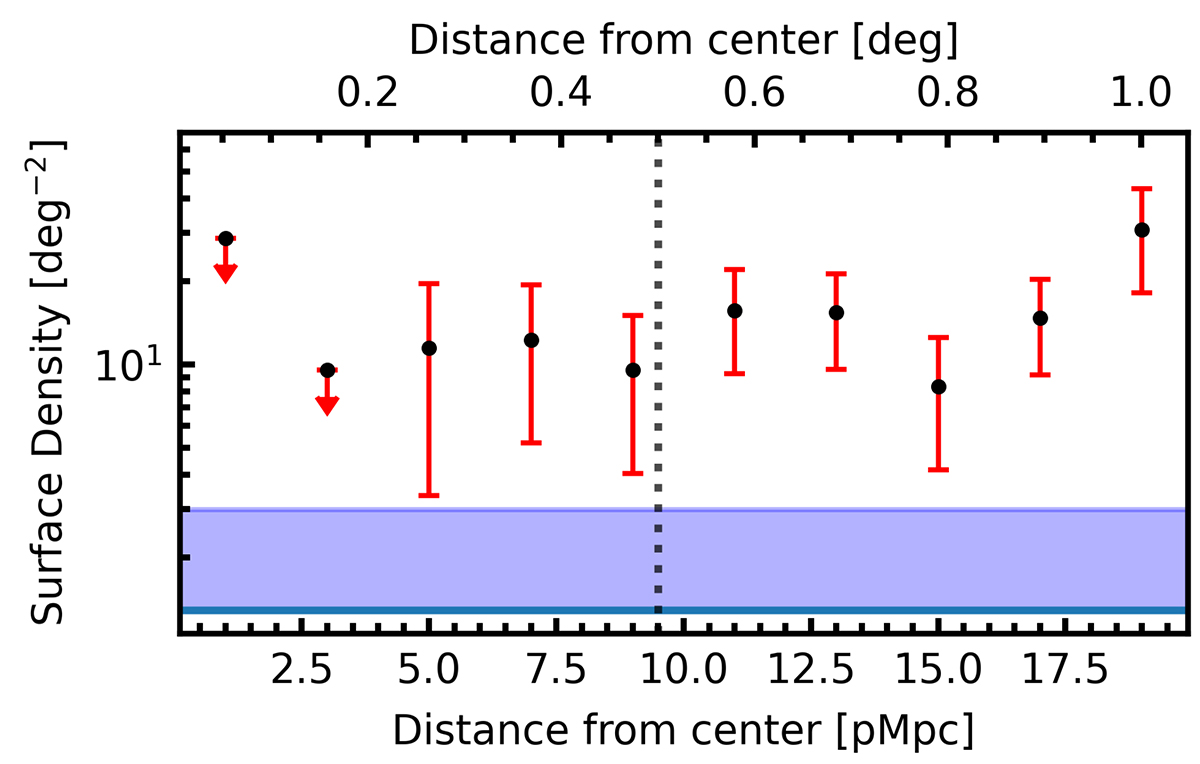
Fig. 9.
Download original image
Surface density profile as a function of distance from the central quasar. The data were binned using 2 pMpc bins. Red arrows indicate the 1σ upper limits based on non-detections and assuming a Poisson uncertainty. The blue-shaded region is the average upper limit for the degraded CDFS data. The dashed line is the maximum theoretical collapse radius found by Overzier et al. (2009).
Current usage metrics show cumulative count of Article Views (full-text article views including HTML views, PDF and ePub downloads, according to the available data) and Abstracts Views on Vision4Press platform.
Data correspond to usage on the plateform after 2015. The current usage metrics is available 48-96 hours after online publication and is updated daily on week days.
Initial download of the metrics may take a while.