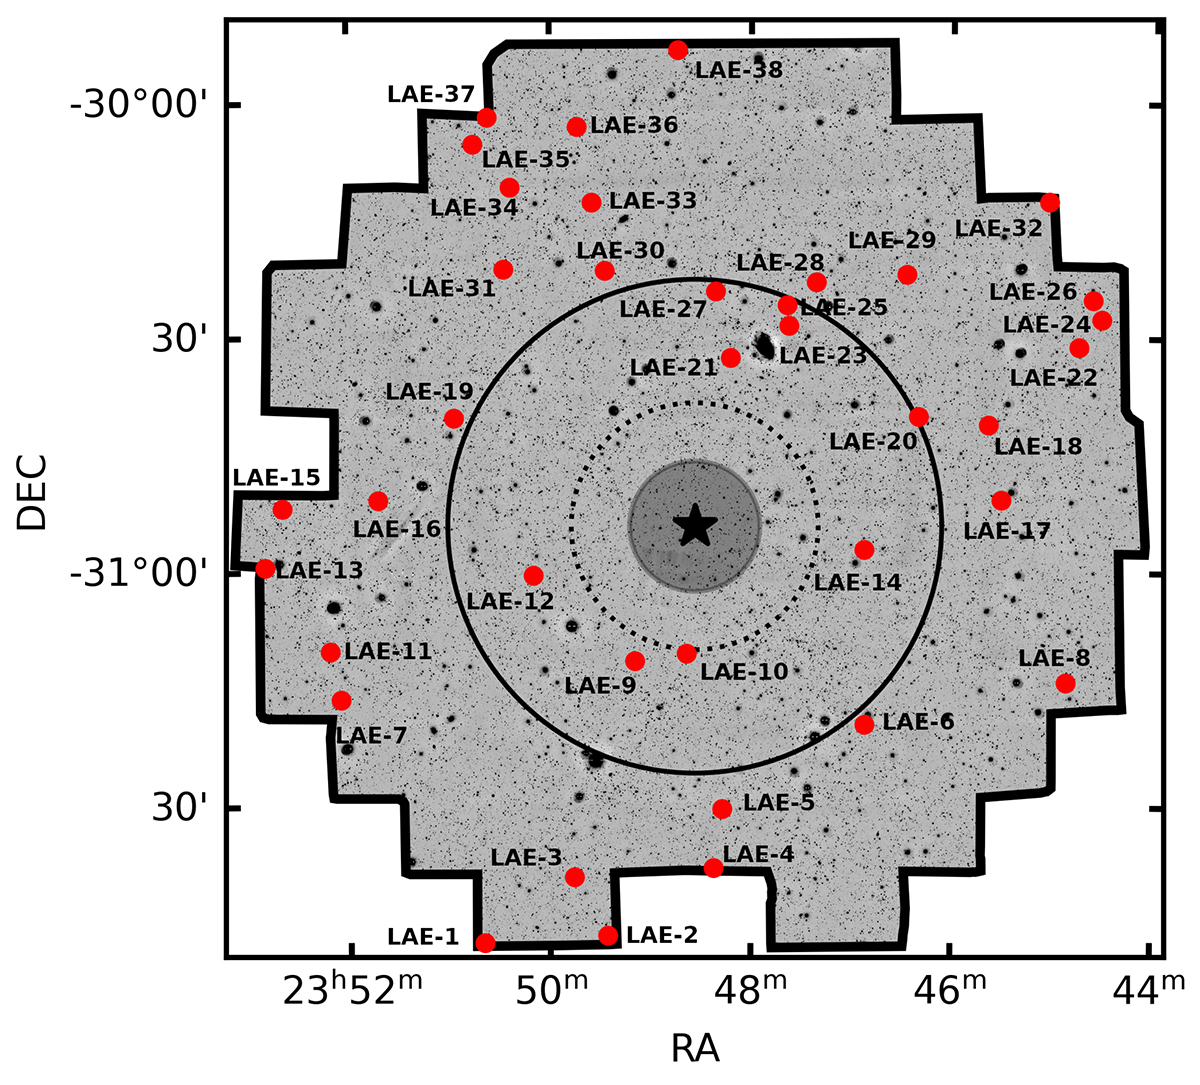
Fig. 6.
Download original image
LAE on-sky distribution around the quasar. Background image is the stacked narrowband DECam image around the quasar. The black outline is the area used to identify LAE and is slightly smaller than the full DECam FOV. The star at the image center is the quasar location. The shaded region shows the proximity zone determined by Mazzucchelli et al. (2017b). The inner and outer rings highlight 5 pMpc and 10 pMpc from the quasar respectively, with the later being the maximum scale at which objects are expected to collapse and form clusters at z = 0 (Overzier et al. 2009).
Current usage metrics show cumulative count of Article Views (full-text article views including HTML views, PDF and ePub downloads, according to the available data) and Abstracts Views on Vision4Press platform.
Data correspond to usage on the plateform after 2015. The current usage metrics is available 48-96 hours after online publication and is updated daily on week days.
Initial download of the metrics may take a while.