Open Access
Fig. 1.
Download original image
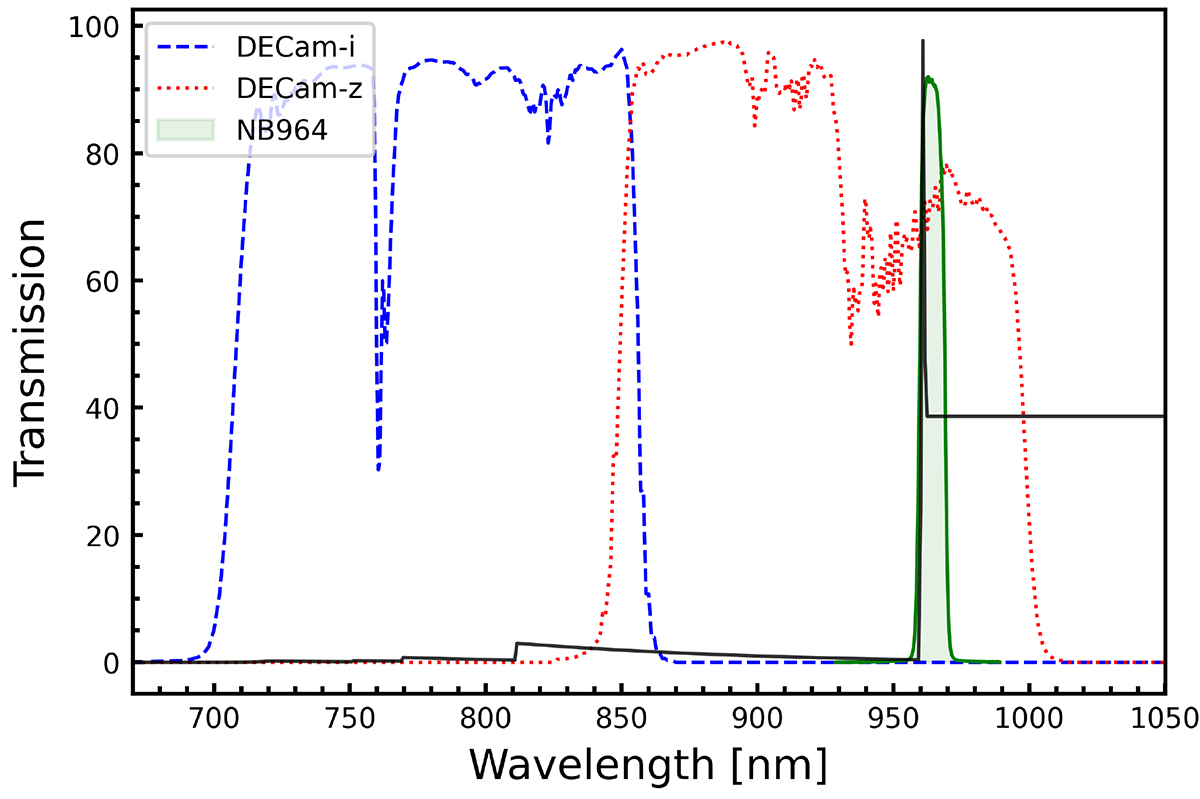
Transmission curves for the filters used in this work. The narrowband (NB964 filter) is represented by a solid green line and the two broadbands are represented by the dashed blue and red lines, for i and z, respectively. The LAE synthetic spectrum is shown as the solid black line.
Current usage metrics show cumulative count of Article Views (full-text article views including HTML views, PDF and ePub downloads, according to the available data) and Abstracts Views on Vision4Press platform.
Data correspond to usage on the plateform after 2015. The current usage metrics is available 48-96 hours after online publication and is updated daily on week days.
Initial download of the metrics may take a while.