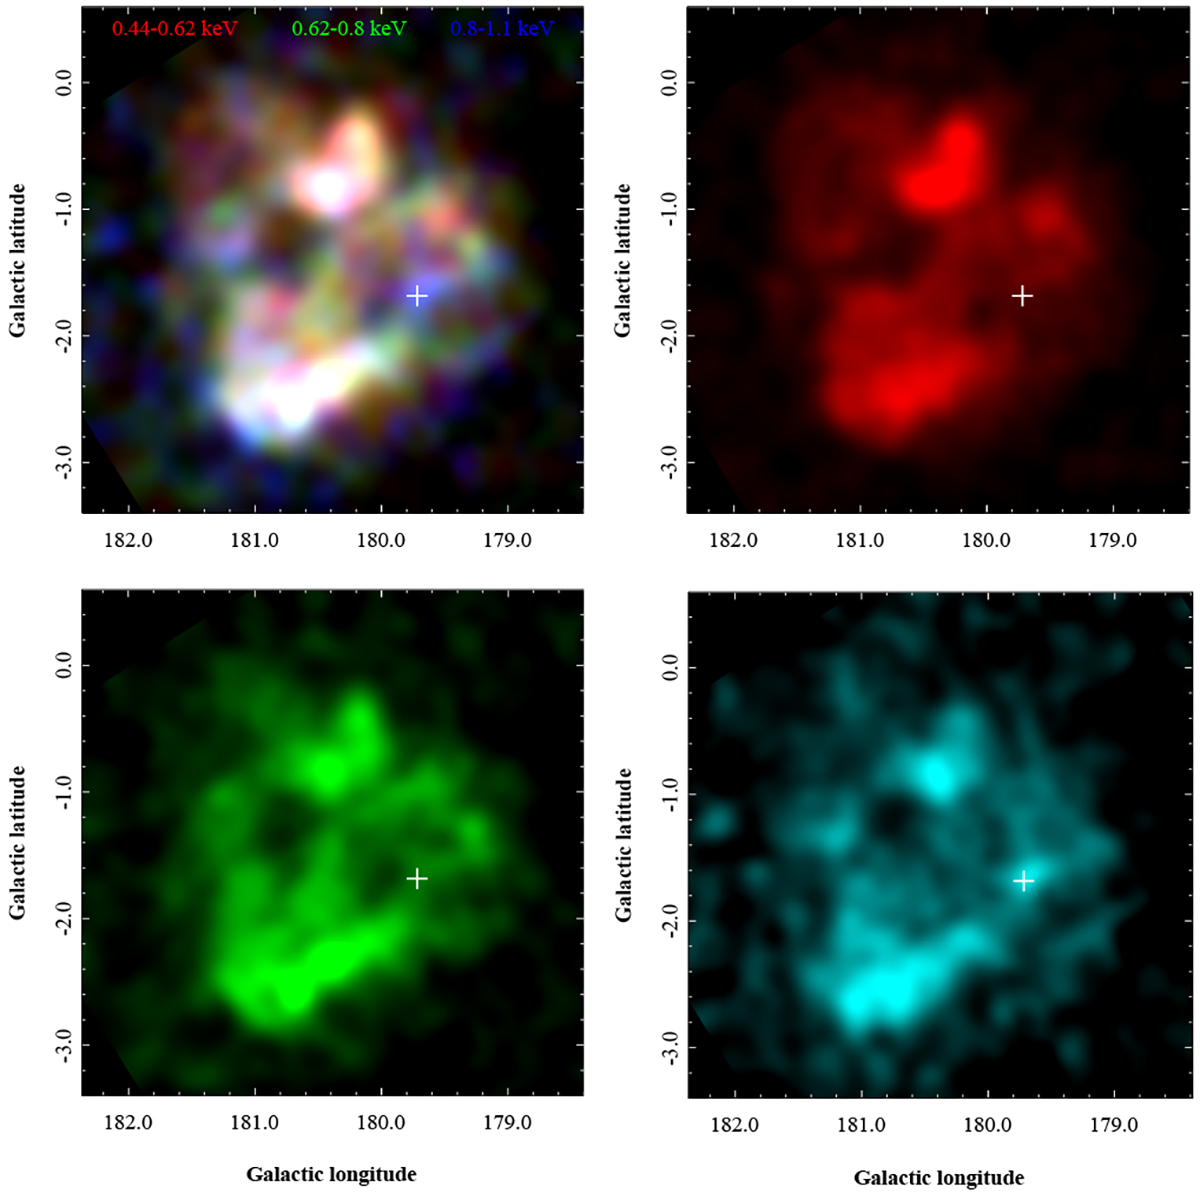
Fig. 4.
Download original image
RGB-composite (top left) and individual narrow-band X-ray images covering the 0.44–1.1 keV band. The red, green, and cyan (instead of blue, for better visibility) images correspond to the 0.44–0.62, 0.62–0.8, and 0.8–1.1 keV bands, respectively. These bands encompass the three brightest X-ray emission lines in the spectrum of S147: O VII, O VIII, and Ne IX.
Current usage metrics show cumulative count of Article Views (full-text article views including HTML views, PDF and ePub downloads, according to the available data) and Abstracts Views on Vision4Press platform.
Data correspond to usage on the plateform after 2015. The current usage metrics is available 48-96 hours after online publication and is updated daily on week days.
Initial download of the metrics may take a while.