Open Access
Fig. 13.
Download original image
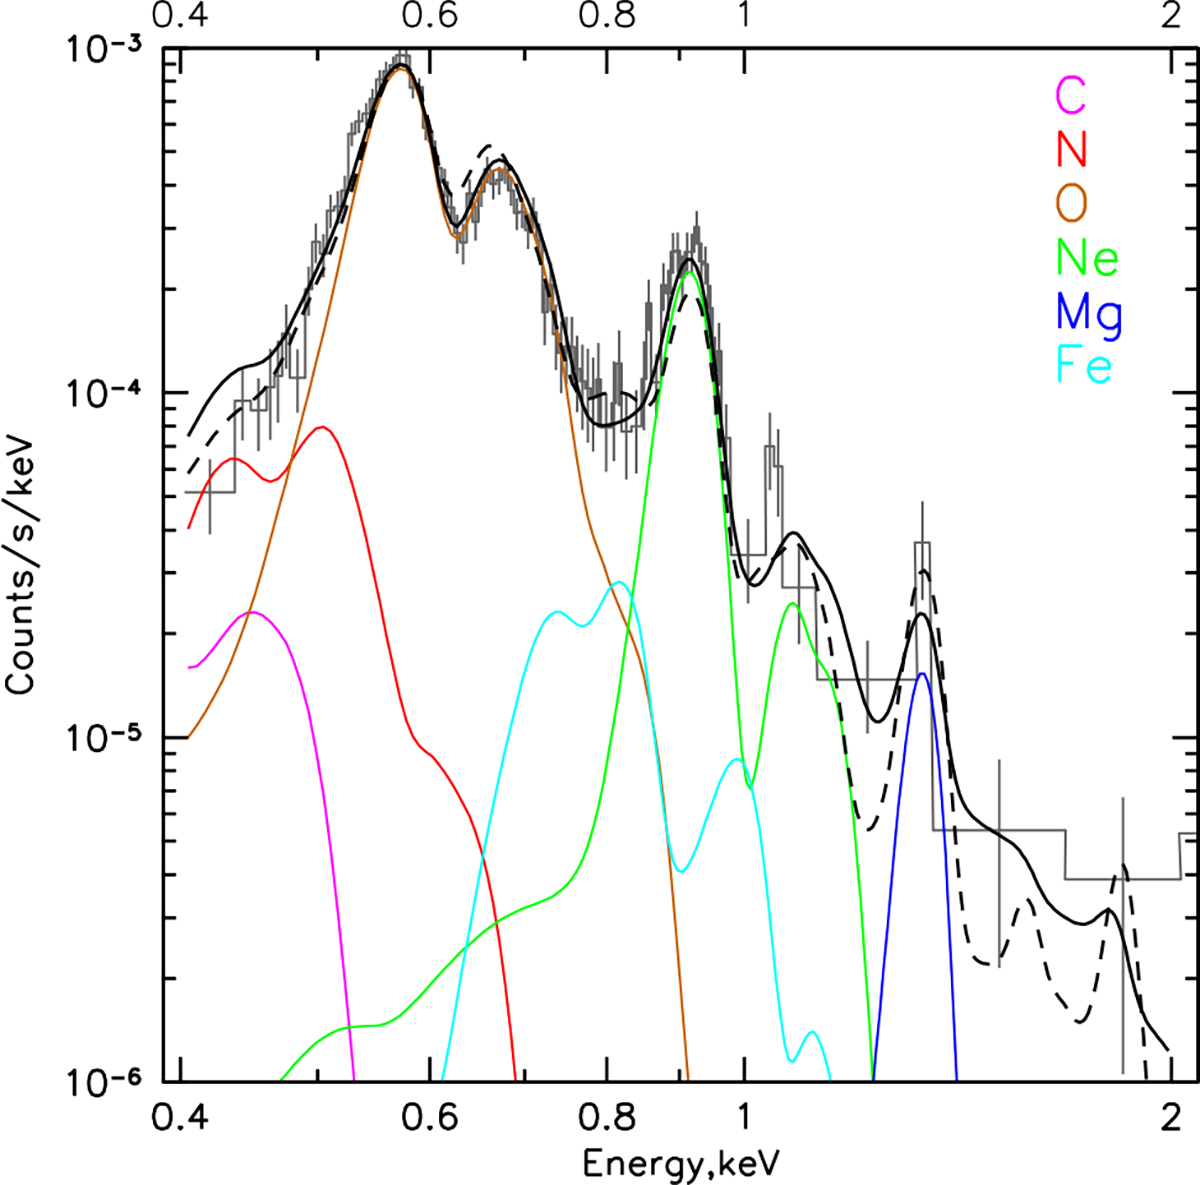
Contribution of individual elements to the S147 X-ray spectrum in the NEI model (solid black line). The dashed line shows the spectrum predicted by the 1D-hydro model.
Current usage metrics show cumulative count of Article Views (full-text article views including HTML views, PDF and ePub downloads, according to the available data) and Abstracts Views on Vision4Press platform.
Data correspond to usage on the plateform after 2015. The current usage metrics is available 48-96 hours after online publication and is updated daily on week days.
Initial download of the metrics may take a while.