Open Access
Fig. 9
Download original image
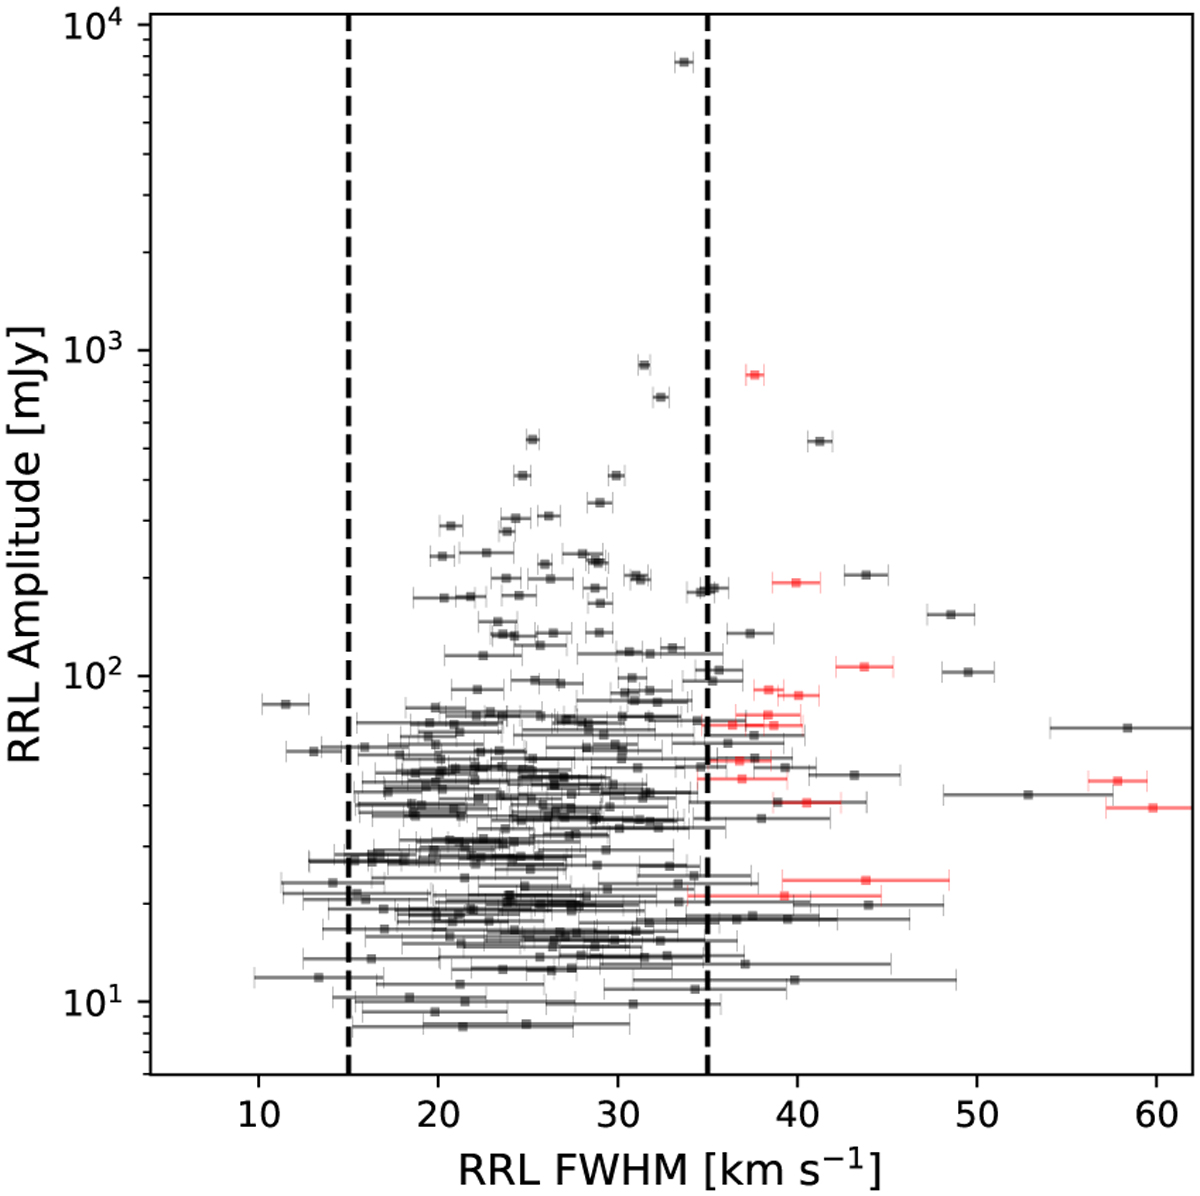
H II region’s RRL intensity as a function of FWHM line width. Vertical dashed lines represent the line width of 35 and 15 km s−1. The distribution of the low intensity sources is similar to the entire source. The candidate HC H II regions are represented by the filled red circle.
Current usage metrics show cumulative count of Article Views (full-text article views including HTML views, PDF and ePub downloads, according to the available data) and Abstracts Views on Vision4Press platform.
Data correspond to usage on the plateform after 2015. The current usage metrics is available 48-96 hours after online publication and is updated daily on week days.
Initial download of the metrics may take a while.