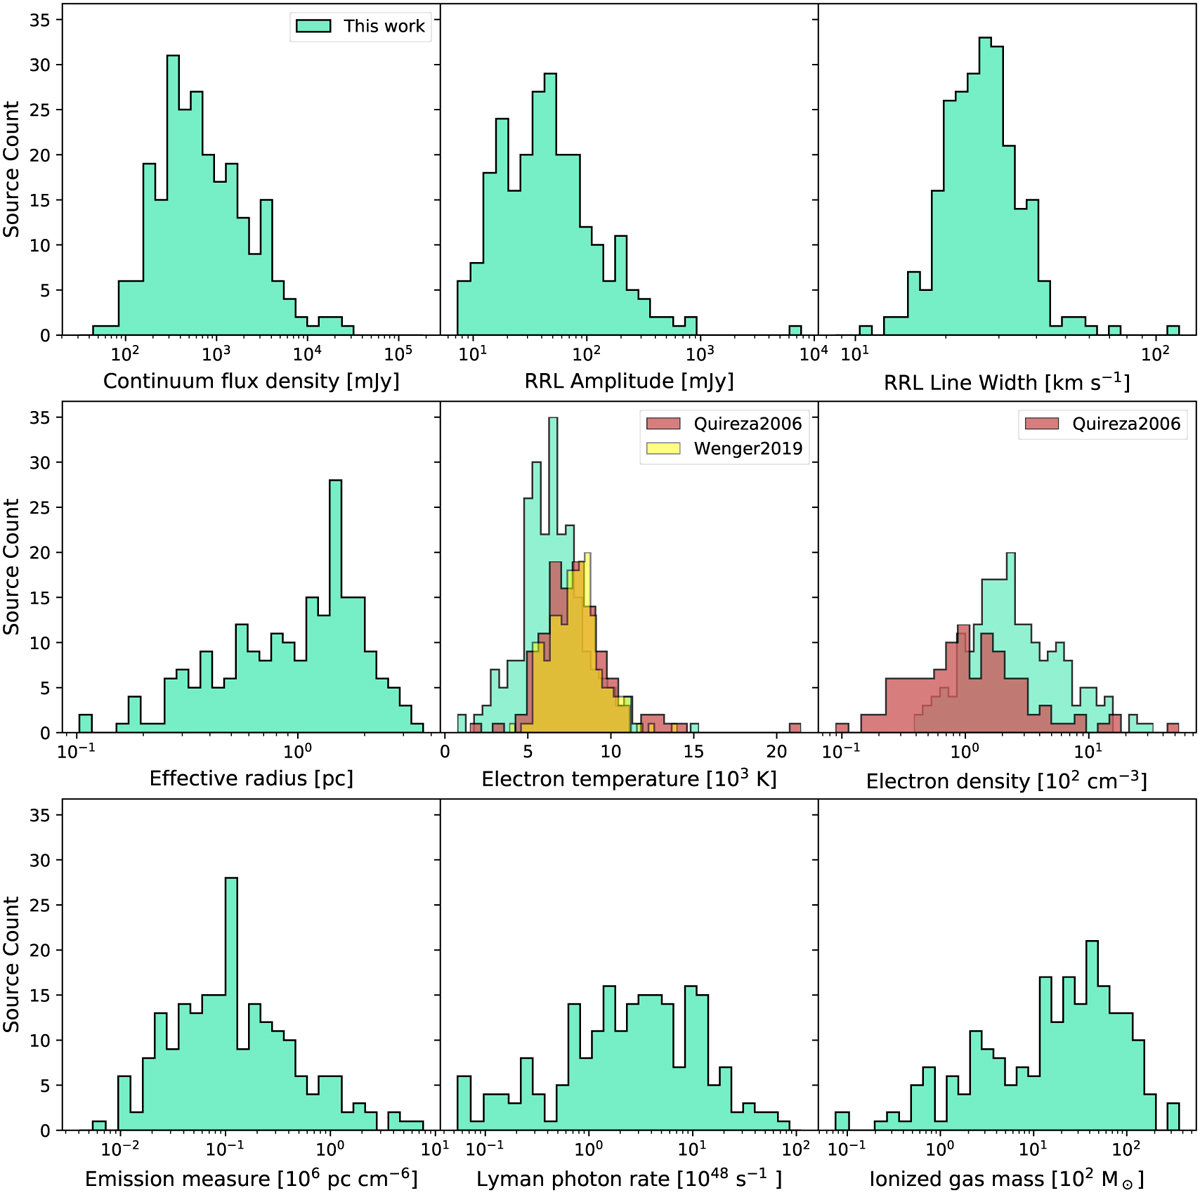
Fig. 8
Download original image
Distributions of various H II region physical properties from top left to bottom right, continuum flux density, RRL amplitude, RRL FWHM, effective radius, electron temperature, electron density, EM, Lyman photon rate, and ionized gas mass. The electron temperature reported by Quireza et al. (2006) is indicated in red, while the one reported by Wenger et al. (2019) is shown in yellow, and these are compared to the GLOSTAR H II region sample (aquamarine). On average, the electron temperature of GLOSTAR H II regions (6707 K) is lower than that of Quireza et al. (2006) (8214 K) and Wenger et al. (2019) (8055 K). Electron density histograms are presented for both the GLOSTAR (aquamarine) and Quireza et al. (2006) (red) H II region samples. On average, the GLOSTAR nebulae have higher electron density than the Quireza et al. (2006) sources.
Current usage metrics show cumulative count of Article Views (full-text article views including HTML views, PDF and ePub downloads, according to the available data) and Abstracts Views on Vision4Press platform.
Data correspond to usage on the plateform after 2015. The current usage metrics is available 48-96 hours after online publication and is updated daily on week days.
Initial download of the metrics may take a while.