Fig. 7
Download original image
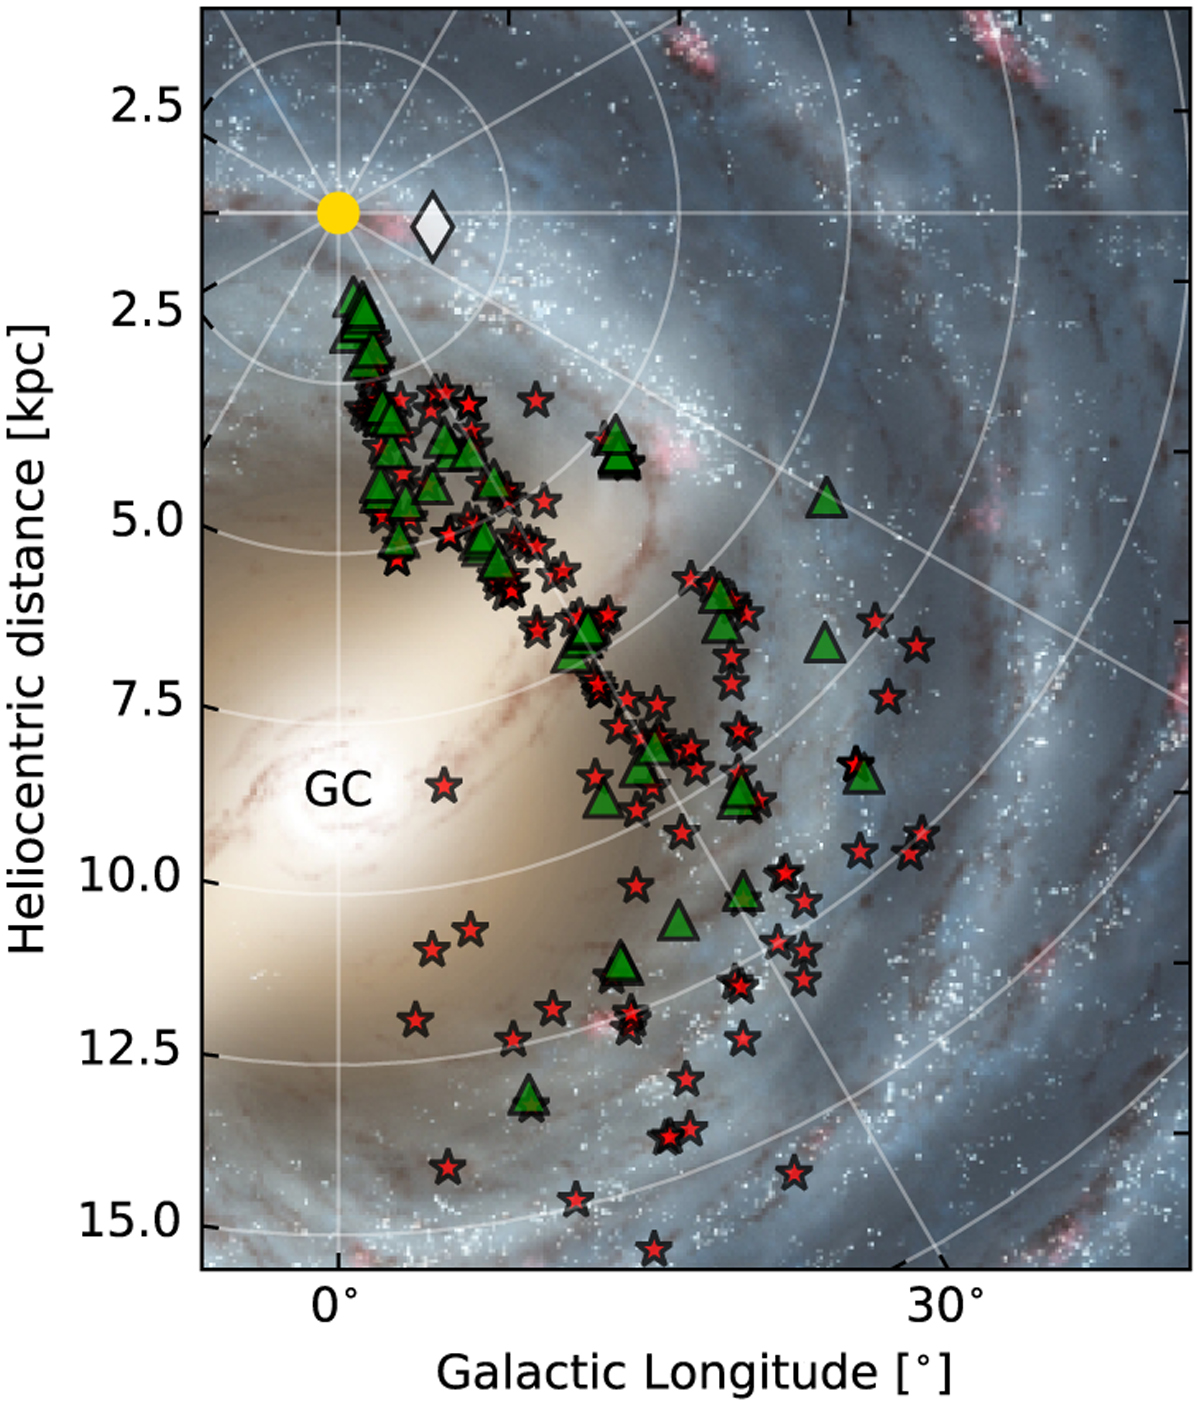
Distances of H II region from GLOSTAR D-configuration VLA observations plotted on top of an artist’s rendition of the Milky Way. The red stars represent the positions of H II regions with distances adopted from the literature, while the green triangles represent H II regions for which we derived the kinematic distances (see text for details). We adopt a distance of 1.4 kpc for Cygnus X H II regions represented by white diamond.
Current usage metrics show cumulative count of Article Views (full-text article views including HTML views, PDF and ePub downloads, according to the available data) and Abstracts Views on Vision4Press platform.
Data correspond to usage on the plateform after 2015. The current usage metrics is available 48-96 hours after online publication and is updated daily on week days.
Initial download of the metrics may take a while.