Open Access
Fig. 6
Download original image
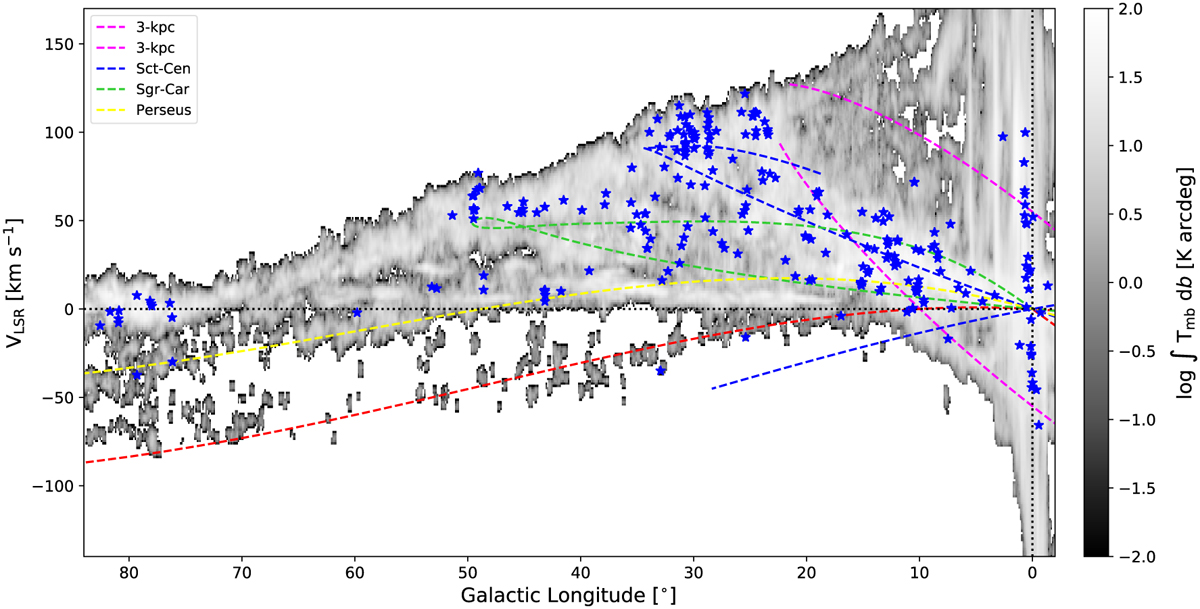
Distribution of detected H II regions RRL peak velocity with respect to the Galactic longitude in blue stars. The dashed lines represent the updated spiral arm models of Taylor & Cordes (1993). The background shows the CO emission from Dame et al. (2001).
Current usage metrics show cumulative count of Article Views (full-text article views including HTML views, PDF and ePub downloads, according to the available data) and Abstracts Views on Vision4Press platform.
Data correspond to usage on the plateform after 2015. The current usage metrics is available 48-96 hours after online publication and is updated daily on week days.
Initial download of the metrics may take a while.