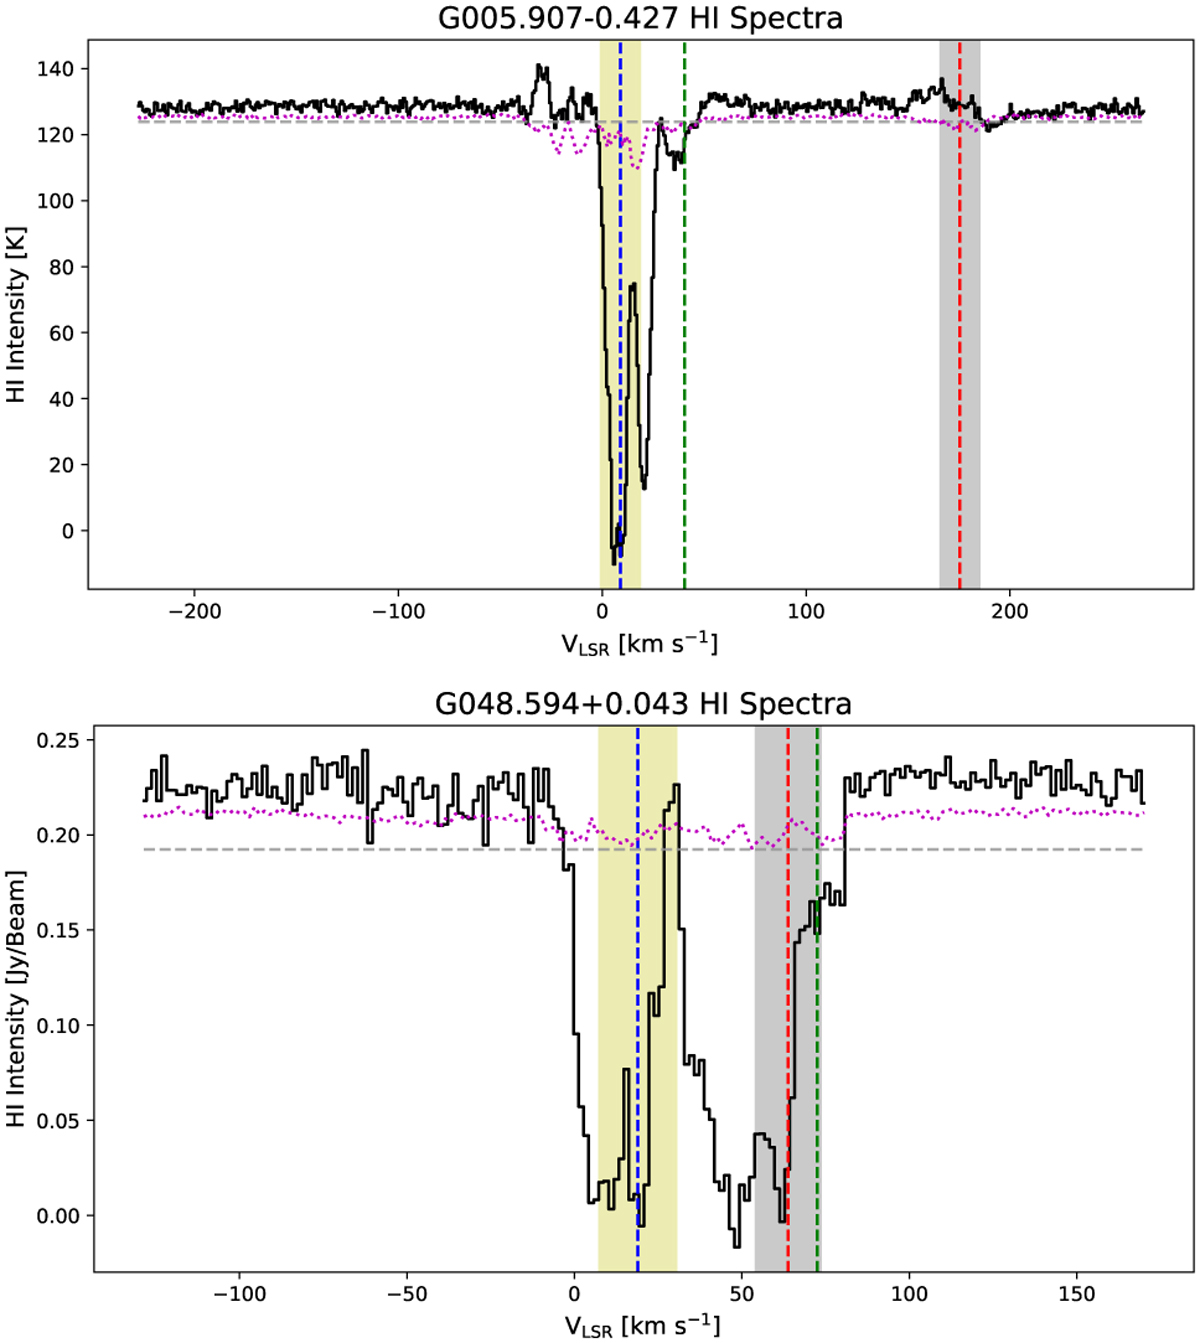
Fig. A.1
Download original image
Source-averaged continuum-included H I spectra toward the H II regions extracted from the H I SGPS (top panel) and THOR survey (bottom panel). The source velocity (Vlsr), the velocity of tangent point (VT), and the velocity of the first absorption minimum (VA) are shown by the vertical dashed blue, red, and green lines, respectively. The yellow shaded region around the source velocity represents the line width of the RRL and gray shaded region around velocity of the tangent point covers 10km s−1 either side and is provided to give an indication of the uncertainty associated with the streaming motion. The horizontal dashed gray and dotted purple lines show the 4σrms receiver noise level and the H I emission fluctuations, respectively. We provide example of sources placed at the near and far distance in the top and bottom panels, respectively.
Current usage metrics show cumulative count of Article Views (full-text article views including HTML views, PDF and ePub downloads, according to the available data) and Abstracts Views on Vision4Press platform.
Data correspond to usage on the plateform after 2015. The current usage metrics is available 48-96 hours after online publication and is updated daily on week days.
Initial download of the metrics may take a while.