Fig. 19
Download original image
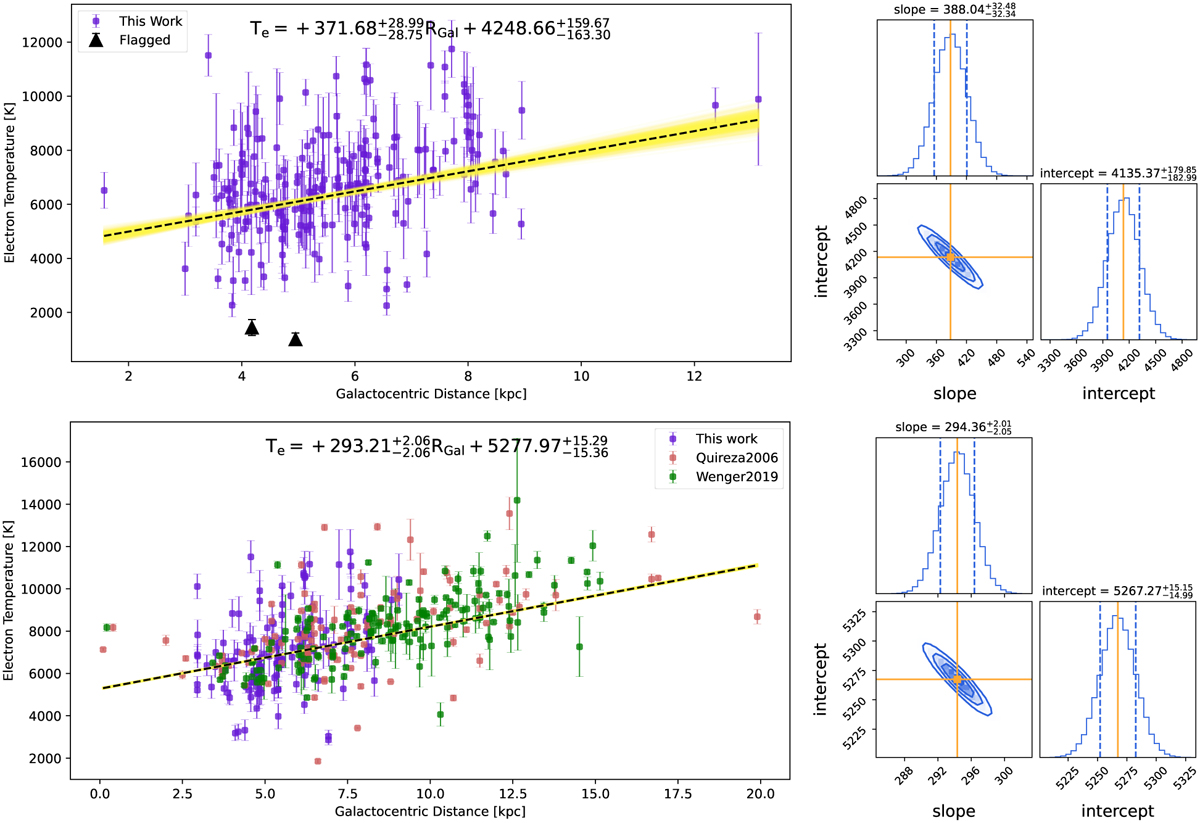
Most likely electron temperature gradient determined using the Bayesian linear regression with the MCMC sampling for different samples. The left panel shows the data and the most likely linear model in the dashed black line. The error bars are 1σ uncertainty in the derived electron temperature. The shaded yellow region represents the range of fits from 10 000 MCMC iterations. The black triangles represent the outlier data points which are flagged before the fitting, while the filled purple circles represent the data used for fitting. The right panel shows the corresponding corner plot displaying the one-dimensional (1D) histogram of the posterior distribution for each parameter (slope and y-intercept). The histograms represent the probability density functions (PDFs) of the Monte Carlo fit parameters, while the blue curves represent the scatter plot of the joint distribution between the two parameters. The solid orange lines indicate the peaks of the PDFs, representing the most likely fit parameters, and the dotted blue lines correspond to the 1σ confidence intervals. Top panel: Case 1: Consists of all 213 sources in our catalog excluding the Galactic center H II due to lack of reliable distance estimate. Bottom panel: Case 2: consists of 496 sources located within RGal range of 0.1–20.0 kpc from Quireza et al. (2006), Wenger et al. (2019), and our catalog. The electron temperature gradient for each sample is given in the plots.
Current usage metrics show cumulative count of Article Views (full-text article views including HTML views, PDF and ePub downloads, according to the available data) and Abstracts Views on Vision4Press platform.
Data correspond to usage on the plateform after 2015. The current usage metrics is available 48-96 hours after online publication and is updated daily on week days.
Initial download of the metrics may take a while.