Fig. 16
Download original image
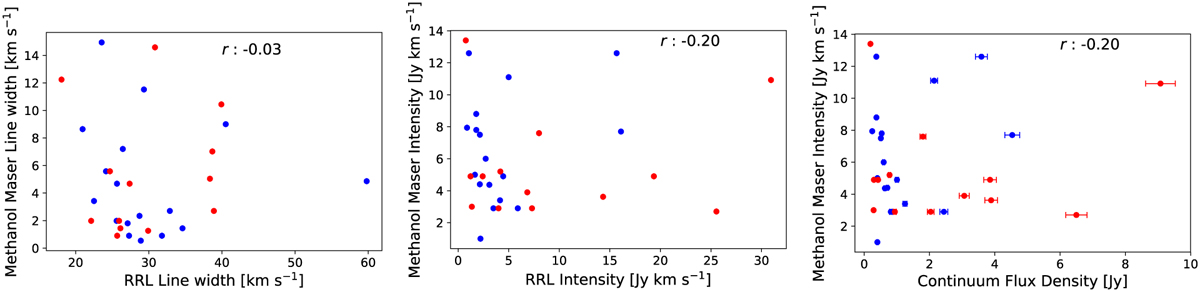
Left: RRL width plotted as a function of the methanol maser line width. RRL integrated intensity (middle) and continuum flux density (right) plotted as a function of maser integrated intensity. Blue and red circle corresponds to a separation of less and more than 6″ respectively. Sources with a positional offset between the H II region and methanol maser of less than 6″ are depicted using filled black circles, while sources with a positional offset greater than 6″ but less than 12″ are represented by black circles. There appears to be no evident correlation between the strengths of the continuum or RRL and the maser. Additionally, no correlation is found between the line width of the RRL and the maser signals.
Current usage metrics show cumulative count of Article Views (full-text article views including HTML views, PDF and ePub downloads, according to the available data) and Abstracts Views on Vision4Press platform.
Data correspond to usage on the plateform after 2015. The current usage metrics is available 48-96 hours after online publication and is updated daily on week days.
Initial download of the metrics may take a while.