Fig. 15
Download original image
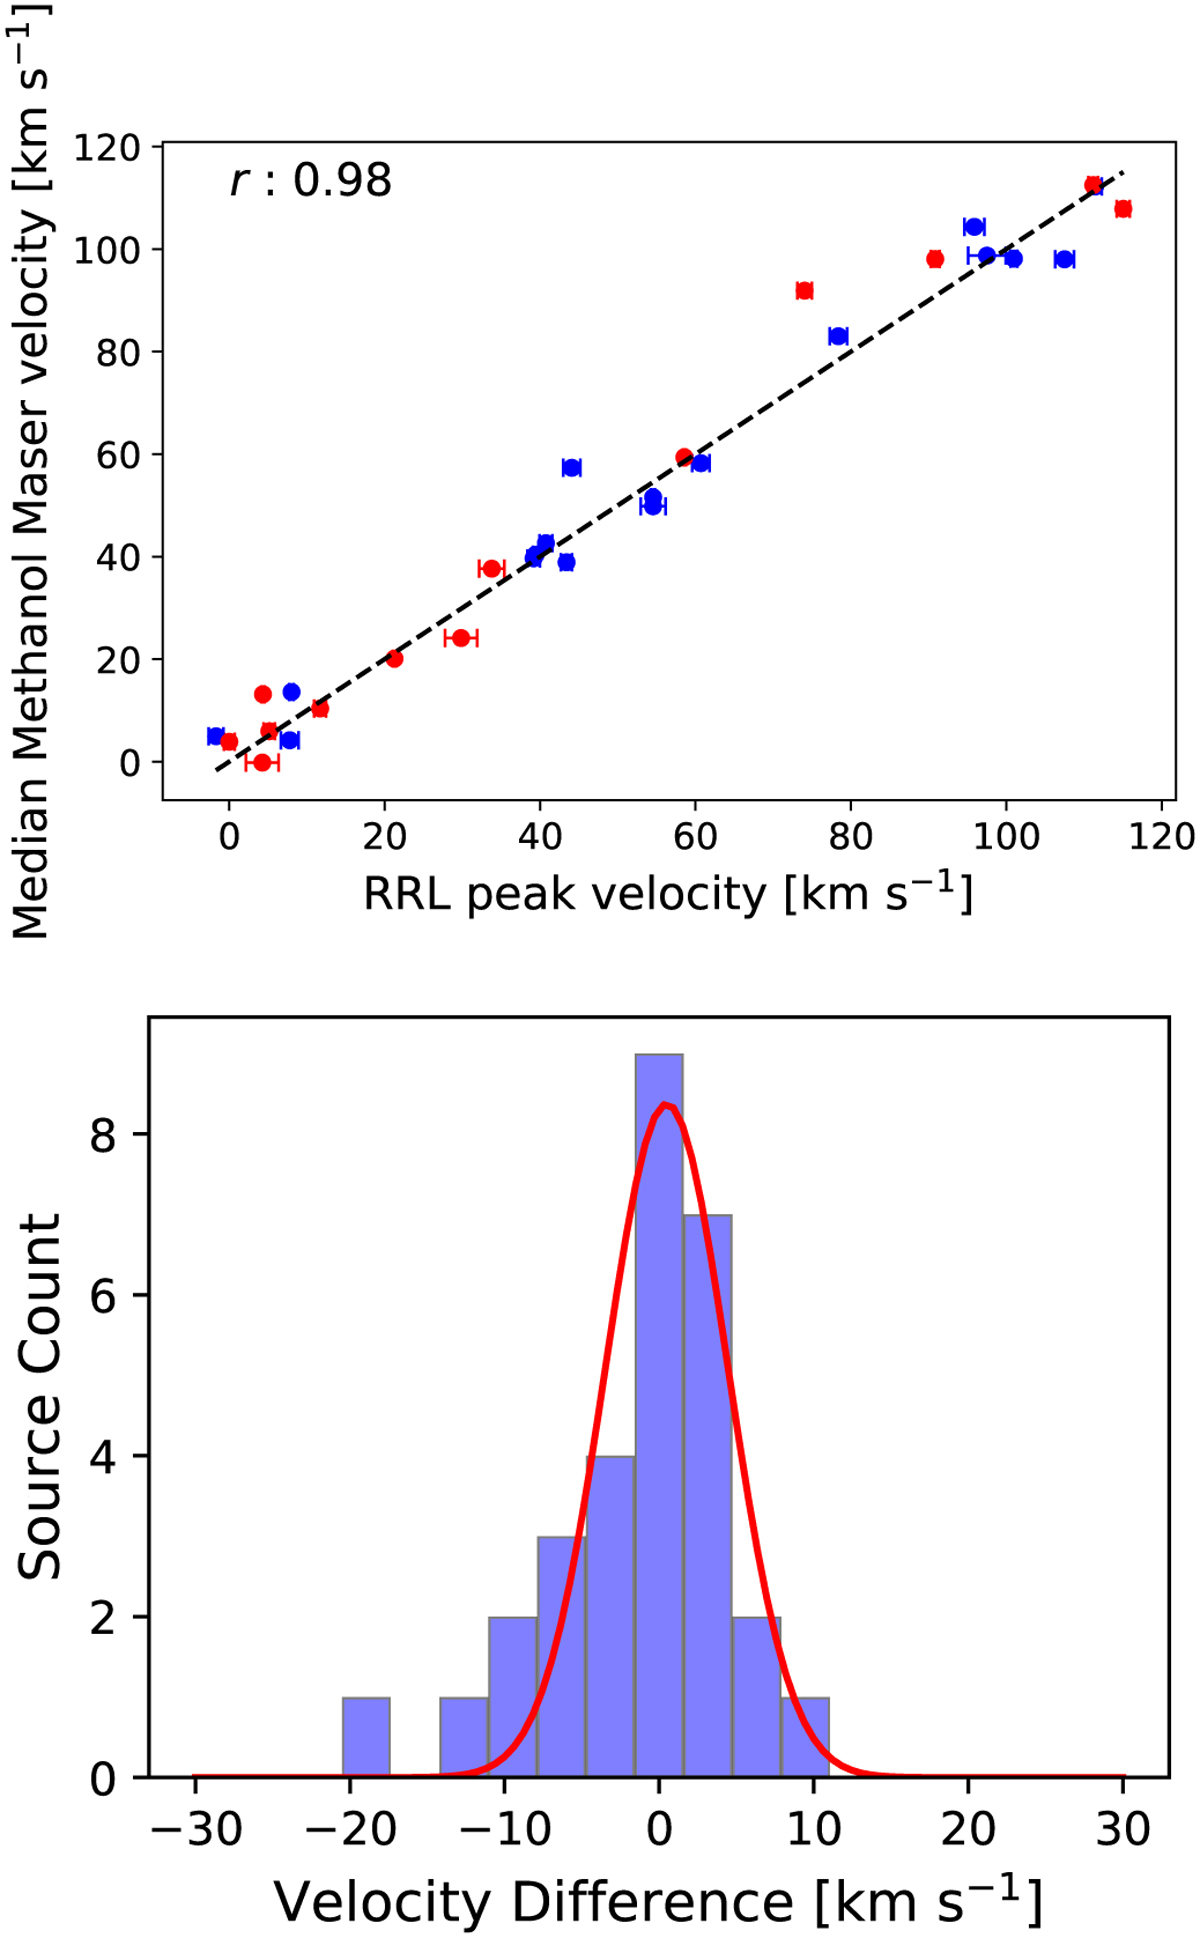
Comparison between the RRL peak velocity and median methanol maser velocity. Top: the RRL peak velocity is plotted against the median methanol maser velocity. Sources with a positional offset between the H II region and methanol maser of less than 6″ are depicted using blue circles, while sources with a positional offset greater than 6″ but less than 12″ are represented by red circles. The dashed black line represents the line of equality, x=y, with a Spearman’s rank coefficient of r = 0.98 and p-value ≪ 0.0013. Bottom: the distribution of velocity offsets between the RRL peak velocities and median methanol maser velocity is shown. Fitting the distribution with Gaussian yield a mean of 0.5 ± 0.3 km s−1 and standard deviation of 4.0 ± 0.34 km s−1.
Current usage metrics show cumulative count of Article Views (full-text article views including HTML views, PDF and ePub downloads, according to the available data) and Abstracts Views on Vision4Press platform.
Data correspond to usage on the plateform after 2015. The current usage metrics is available 48-96 hours after online publication and is updated daily on week days.
Initial download of the metrics may take a while.