Fig. 14
Download original image
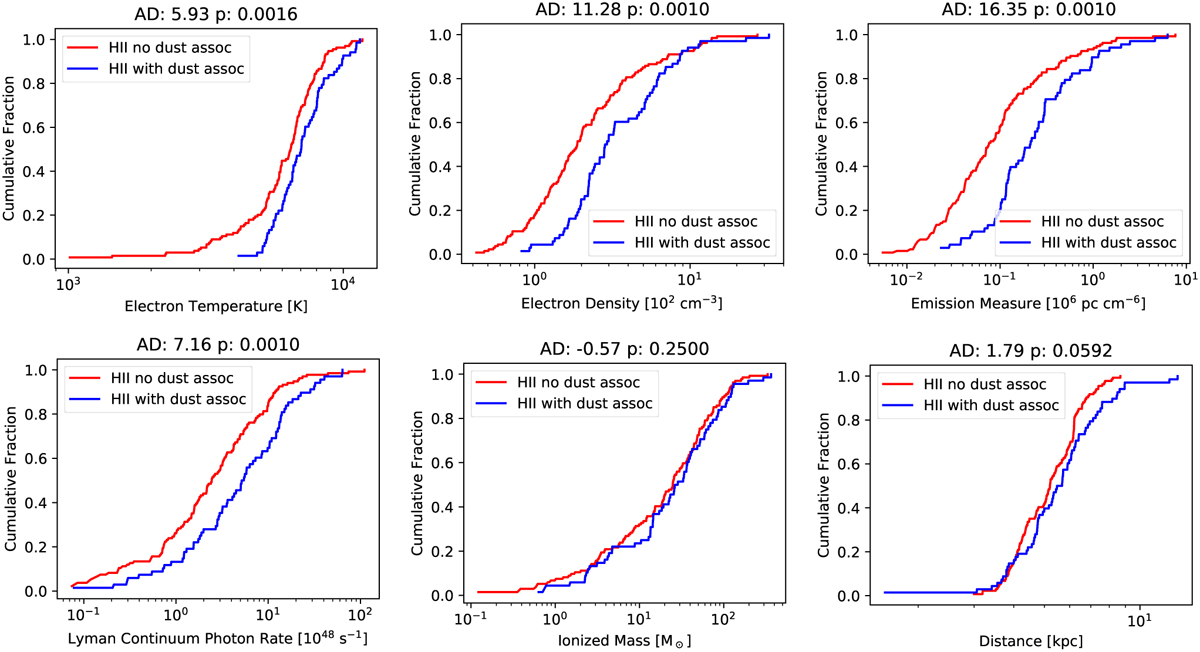
Comparison between the properties of GLOSTAR H II regions that are associated with ATLASGAL dust clumps (in red) and those that are not linked to ATLASGAL clumps (in blue). CDFs are presented for various properties of GLOSTAR H II regions. The results of the Anderson-Darling (AD) tests, indicated above each plot, provide insights into the statistical significance of the observed differences.
Current usage metrics show cumulative count of Article Views (full-text article views including HTML views, PDF and ePub downloads, according to the available data) and Abstracts Views on Vision4Press platform.
Data correspond to usage on the plateform after 2015. The current usage metrics is available 48-96 hours after online publication and is updated daily on week days.
Initial download of the metrics may take a while.