Open Access
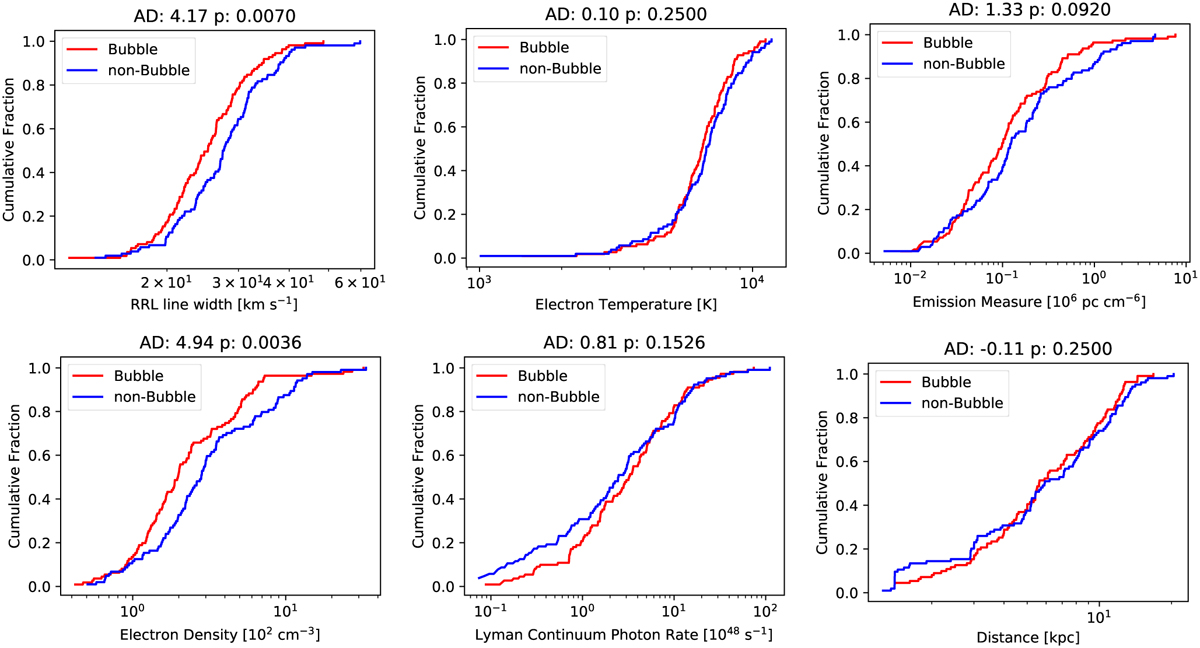
Fig. 12
Download original image
CDFs for various properties of GLOSTAR H II regions. We compare the sample of the GLOSTAR H II regions with Bubble morphology (in red) to the sample of GLOSTAR H II regions non-bubble morphology (in blue). The results of the Anderson-Darling (AD) tests are presented above each plot.
Current usage metrics show cumulative count of Article Views (full-text article views including HTML views, PDF and ePub downloads, according to the available data) and Abstracts Views on Vision4Press platform.
Data correspond to usage on the plateform after 2015. The current usage metrics is available 48-96 hours after online publication and is updated daily on week days.
Initial download of the metrics may take a while.