Fig. 10
Download original image
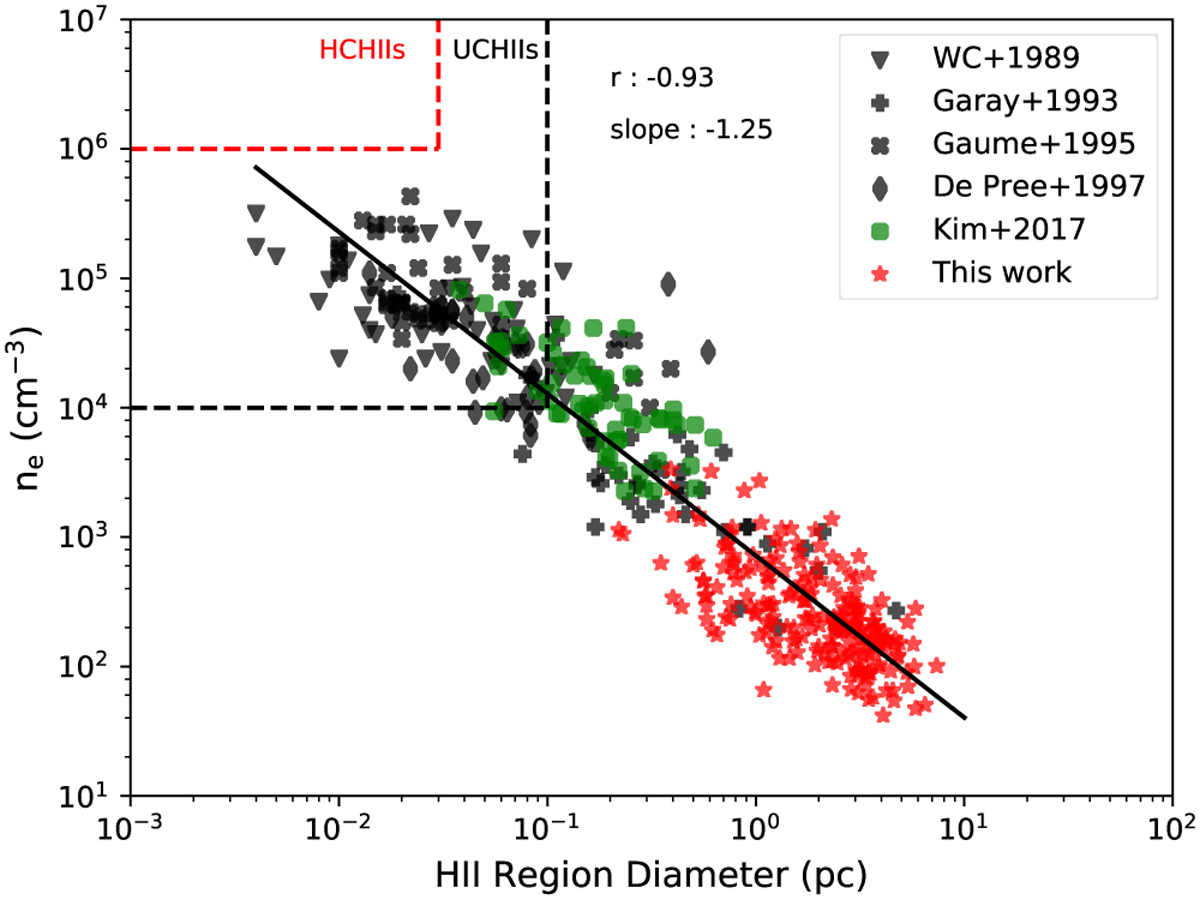
Electron density (ne) as a function of H II region diameter (continuation of Fig. 16 of Kim et al. 2017). Black symbols indicate values determined in previous radio continuum surveys and green circles shows the distribution found for a sample of mm-RRLs by Kim et al. (2017), for which the electron densities are derived from mm-RRL emission. The data from the current work are represented by red stars. The solid black lines represent the best-fit line determined by least-square fit to all data with a Spearman’s rank coefficient of r = −0.92 and p-value ≪0.0013. The dashed red line represents HC H II regions parameter space with diameter ≤0.03 pc and ne ≥ 105 cm3 and the dashed black line represents UC H II regions parameter space with diameter ≤0.1 pc and ne ≥ 104 cm−3 (Kurtz et al. 2000).
Current usage metrics show cumulative count of Article Views (full-text article views including HTML views, PDF and ePub downloads, according to the available data) and Abstracts Views on Vision4Press platform.
Data correspond to usage on the plateform after 2015. The current usage metrics is available 48-96 hours after online publication and is updated daily on week days.
Initial download of the metrics may take a while.