Fig. 1
Download original image
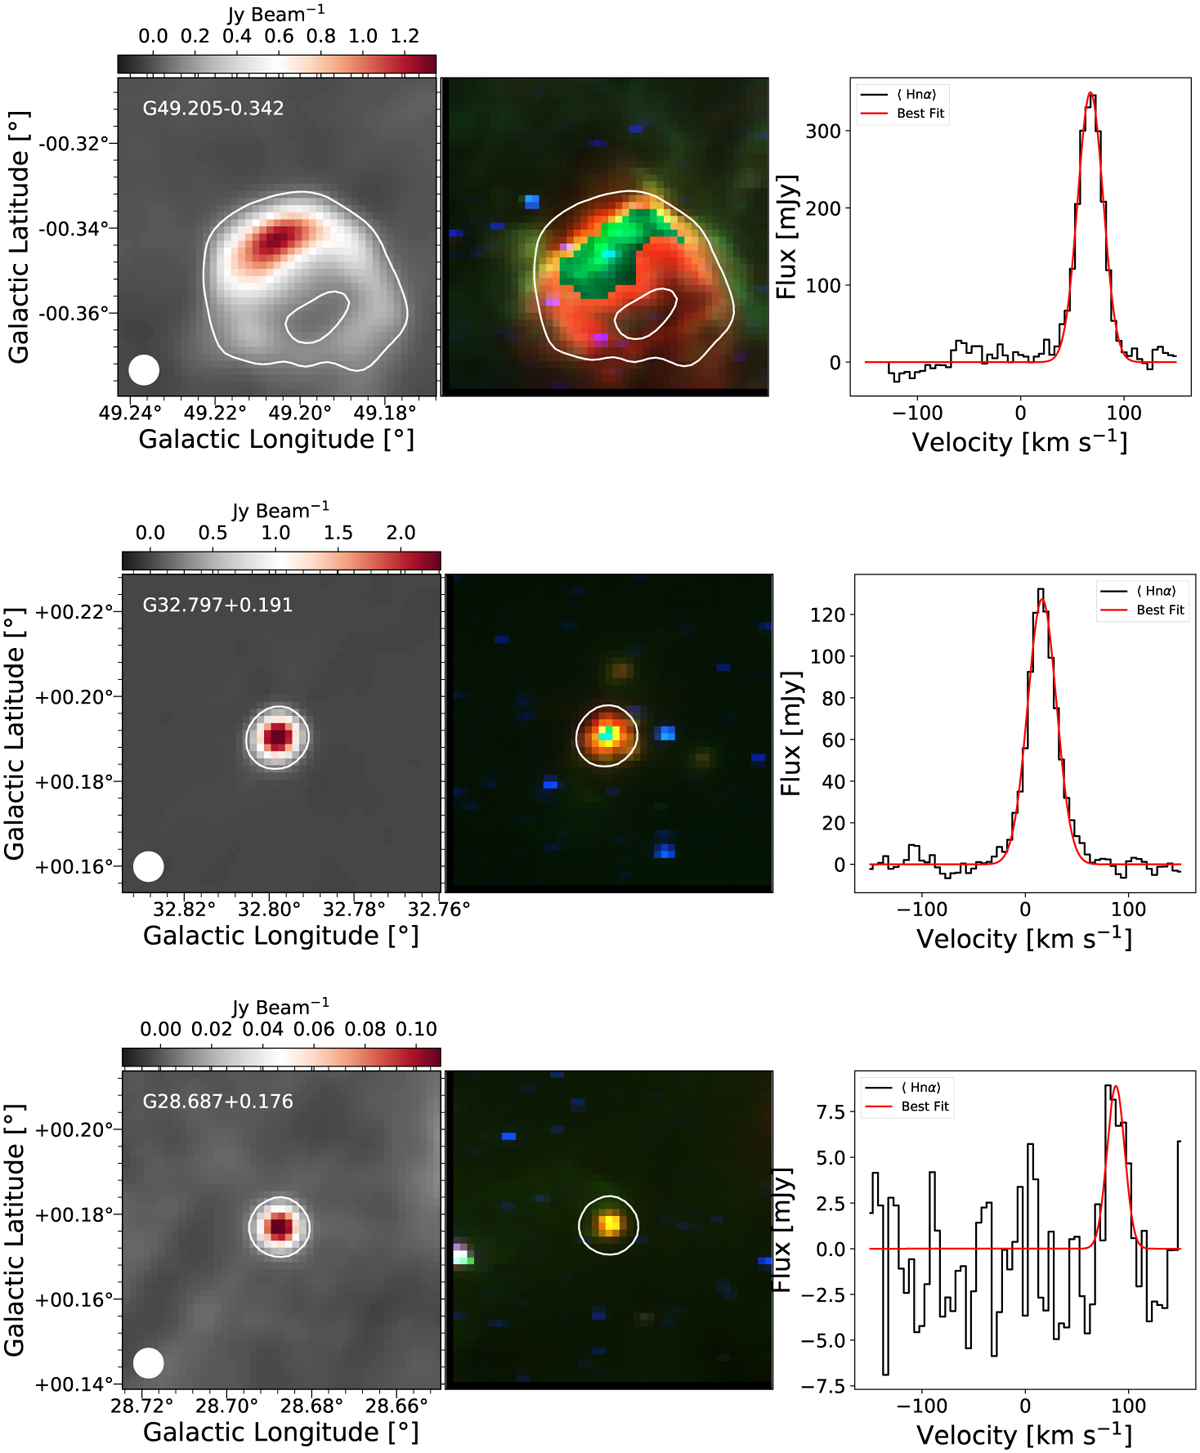
Examples of three GLOSTAR H II regions. G049.205−0.342 (top panel) and G032.797+0.191 (middle panel) exemplify extended and compact radio H II regions found in our catalog, respectively, while G028.687+0.177 (bottom panel) represents the weakest source within our catalog. From left to right: GLOSTAR VLA 5.3 GHz radio continuum emission, a three-color image constructed from Spitzer infrared data: MIPSGAL 24 μm (red), GLIMPSE 8.0 μm (green), and GLIMPSE 3.6 μm (blue), and stacked ⟨Hnα⟩ RRL spectra extracted within the region shown as white contour. The filled white circle shows the 25″ GLOSTAR beam.
Current usage metrics show cumulative count of Article Views (full-text article views including HTML views, PDF and ePub downloads, according to the available data) and Abstracts Views on Vision4Press platform.
Data correspond to usage on the plateform after 2015. The current usage metrics is available 48-96 hours after online publication and is updated daily on week days.
Initial download of the metrics may take a while.