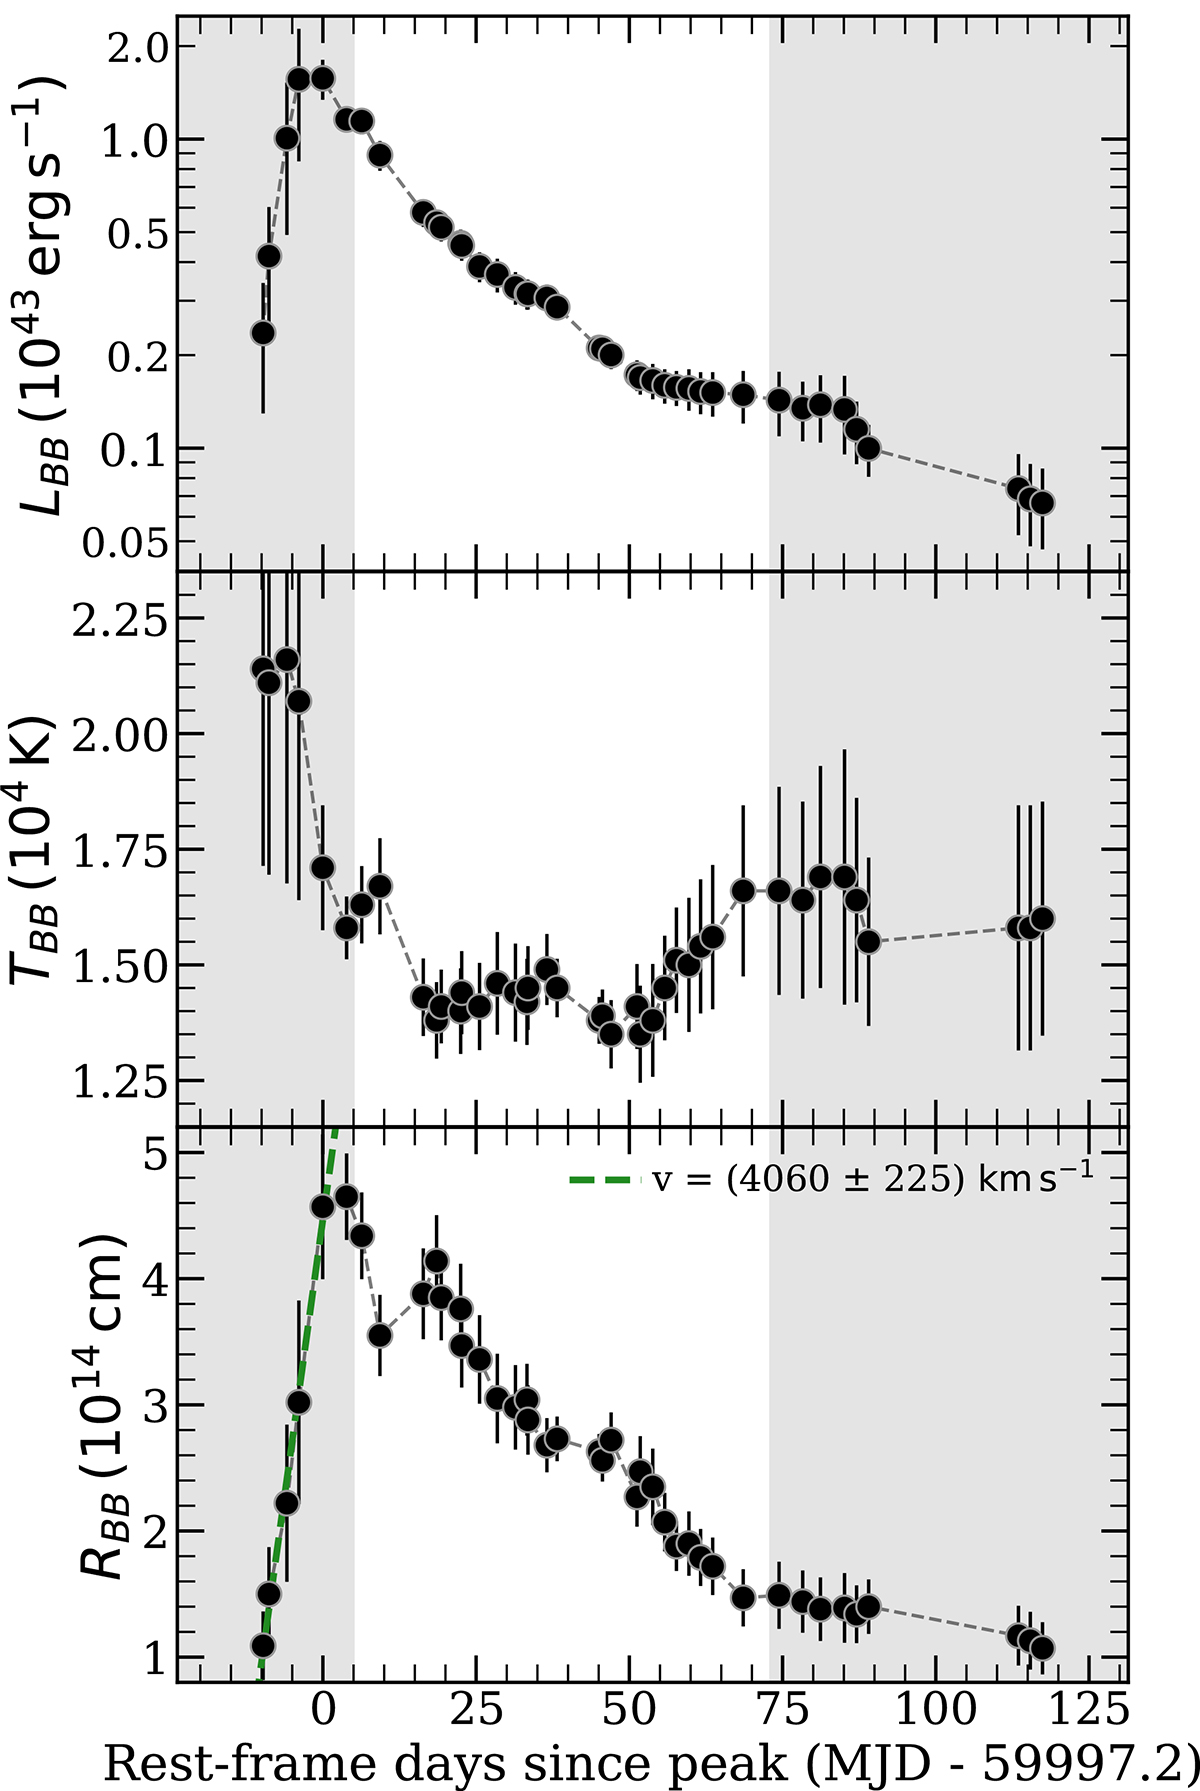
Fig. 7.
Download original image
Bolometric light curve, blackbody temperature, and radius evolution. The luminosity (top panel) is plotted in a log-linear scale. The shaded regions indicate the time regions where constant colour was assumed for extrapolation purposes for some of the bands. There is a break in the temperature evolution (middle panel) around 10−20 days post-peak. This is when He II recombines and we see the emergence of He I in the spectra. The early expansion of the photosphere (bottom panel) is best described (green dashed line) with a constant velocity v ≈ 4000 km s−1 (i.e. ∼0.014c), one of the fastest expansion velocities recorded in TDEs.
Current usage metrics show cumulative count of Article Views (full-text article views including HTML views, PDF and ePub downloads, according to the available data) and Abstracts Views on Vision4Press platform.
Data correspond to usage on the plateform after 2015. The current usage metrics is available 48-96 hours after online publication and is updated daily on week days.
Initial download of the metrics may take a while.