Open Access
Fig. 6.
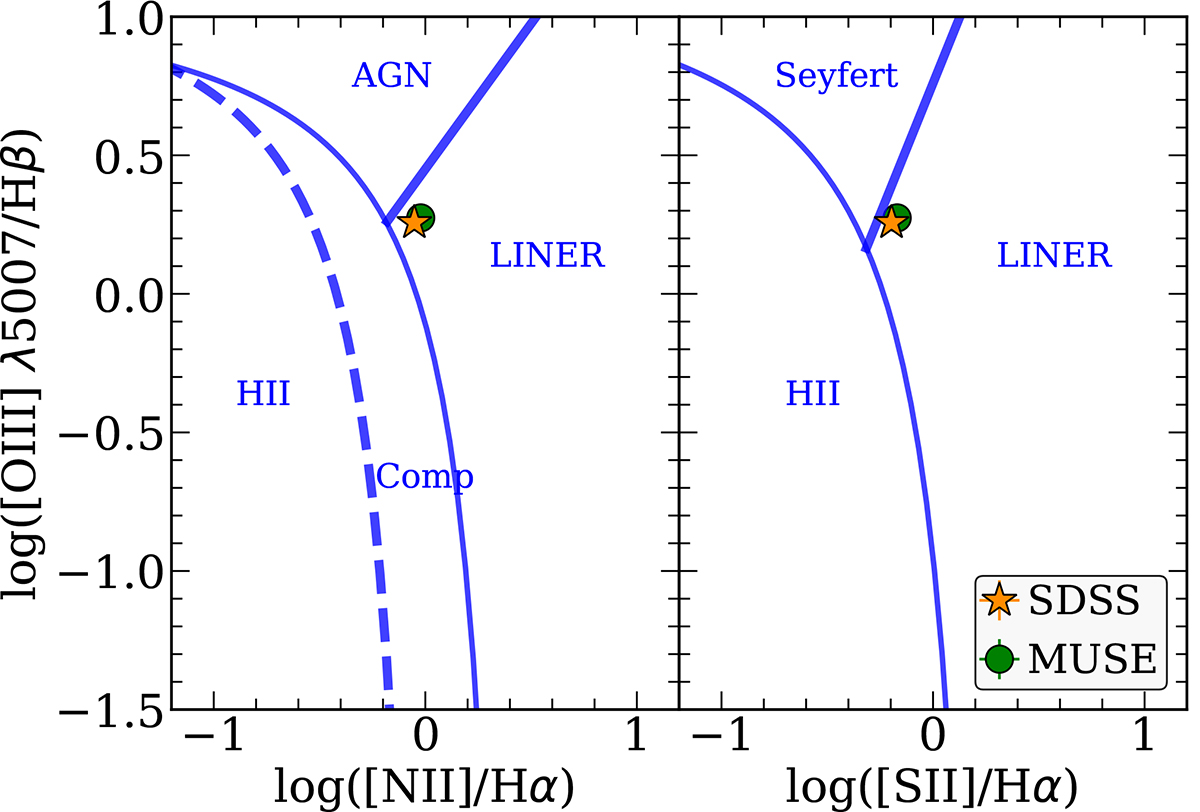
Download original image
BPT diagram of NGC 3799 confirming the LINER nature of the host. The line ratios were measured using both the SDSS nebular spectrum (orange star), and using the MUSE data cubes to extract a spectrum of the nucleus (green circle). ‘Comp’ (left panel) stands for composite region.
Current usage metrics show cumulative count of Article Views (full-text article views including HTML views, PDF and ePub downloads, according to the available data) and Abstracts Views on Vision4Press platform.
Data correspond to usage on the plateform after 2015. The current usage metrics is available 48-96 hours after online publication and is updated daily on week days.
Initial download of the metrics may take a while.