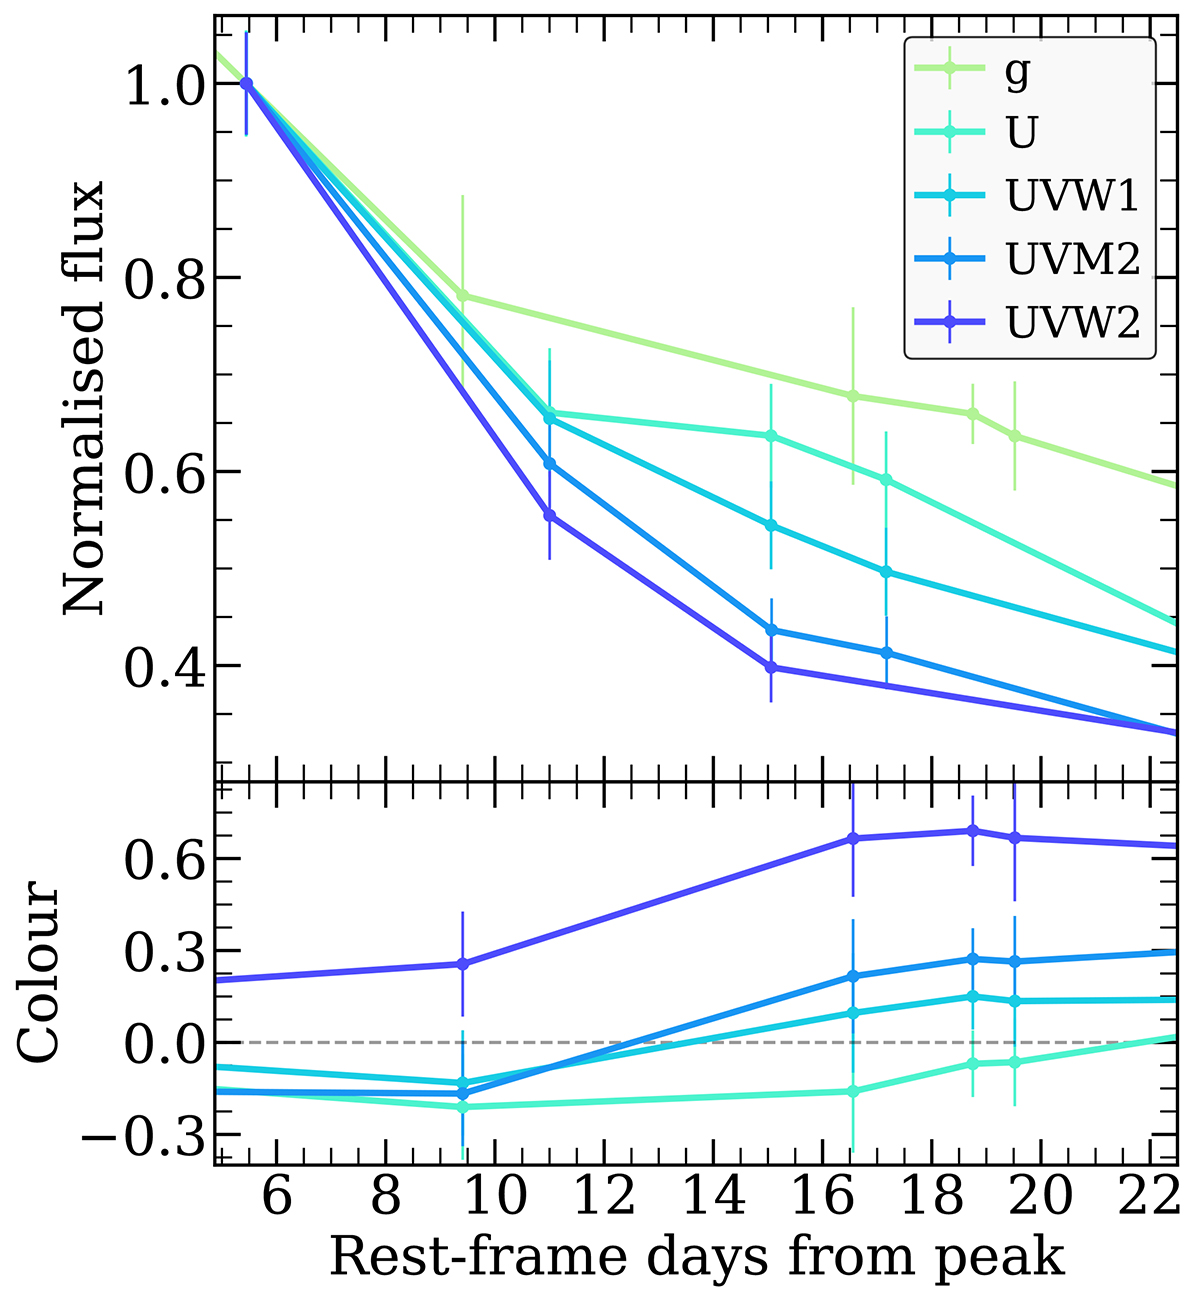
Fig. 3.
Download original image
Focus on the early evolution of the light curves and colours of AT 2023clx. Top panel: Early evolution of the light curves in the bluer bands for comparison with Fig. 2 in flux density space, normalised so that they are all equal to one at the first UVOT epoch. There is a clear wavelength dependence in the decline rate during the first ∼20 days post-peak: the bluer the band, the faster the decline. Bottom panel: Colour evolution of the light curves shown in the top panel with respect to the g-band. There appears to be a ‘rapid cooling’ (unusual for TDEs) that occurs during the first ∼20 days post-peak.
Current usage metrics show cumulative count of Article Views (full-text article views including HTML views, PDF and ePub downloads, according to the available data) and Abstracts Views on Vision4Press platform.
Data correspond to usage on the plateform after 2015. The current usage metrics is available 48-96 hours after online publication and is updated daily on week days.
Initial download of the metrics may take a while.