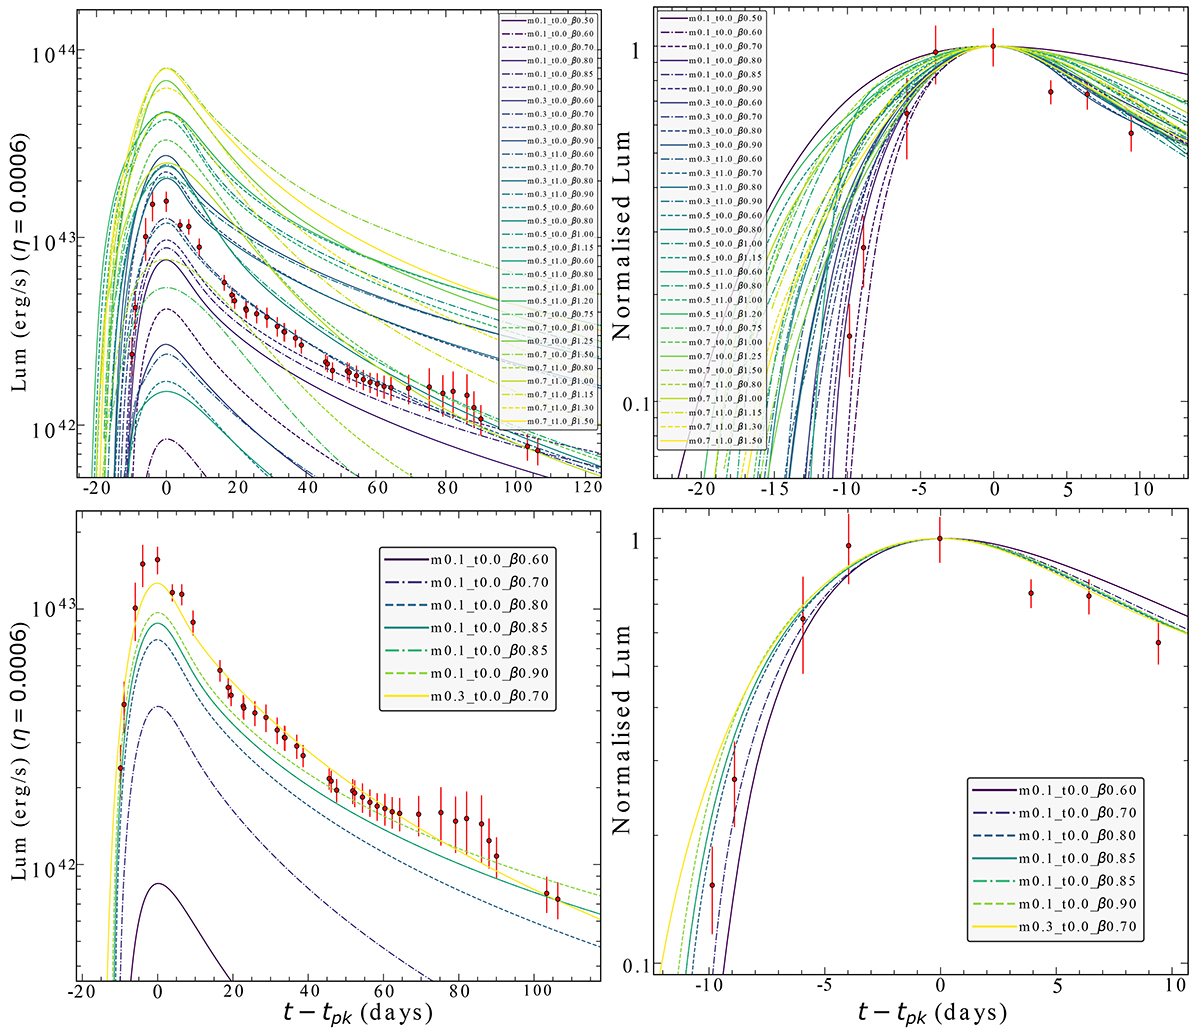
Fig. B.8.
Download original image
Comparison of the bolometric luminosity evolution of AT 2023clx, against mass fallback rate models of Law-Smith et al. (2020) disrupted by a 106.0 BH mass (conveniently matching the one of AT 2023clx). The labels of the models have the following format: mXX_tXX_βXX where the first XX is the star’s mass, the second is the stellar age and the third is the impact parameter of each displayed simulation. In order to convert the mass fallback rate to luminosity we used a radiative efficiency parameter of 6 × 10⁻⁴ which was the best-fit result of our MOSFiT fit. In the left panels the luminosities are not normalised while in the right ones the luminosities are normalised to peak light. The top panels are the same as the bottom ones, but in the top panels we show many models, with stellar masses up to 0.7 M⊙. In the top panels it is obvious that TDEs occurring from higher mass stars have shallower rises while lower mass stars should lead to faster rising light curves, as discussed by Law-Smith et al. 2020. In the bottom panels we show some models that have similar peak luminosities and rise times with AT 2023clx.
Current usage metrics show cumulative count of Article Views (full-text article views including HTML views, PDF and ePub downloads, according to the available data) and Abstracts Views on Vision4Press platform.
Data correspond to usage on the plateform after 2015. The current usage metrics is available 48-96 hours after online publication and is updated daily on week days.
Initial download of the metrics may take a while.