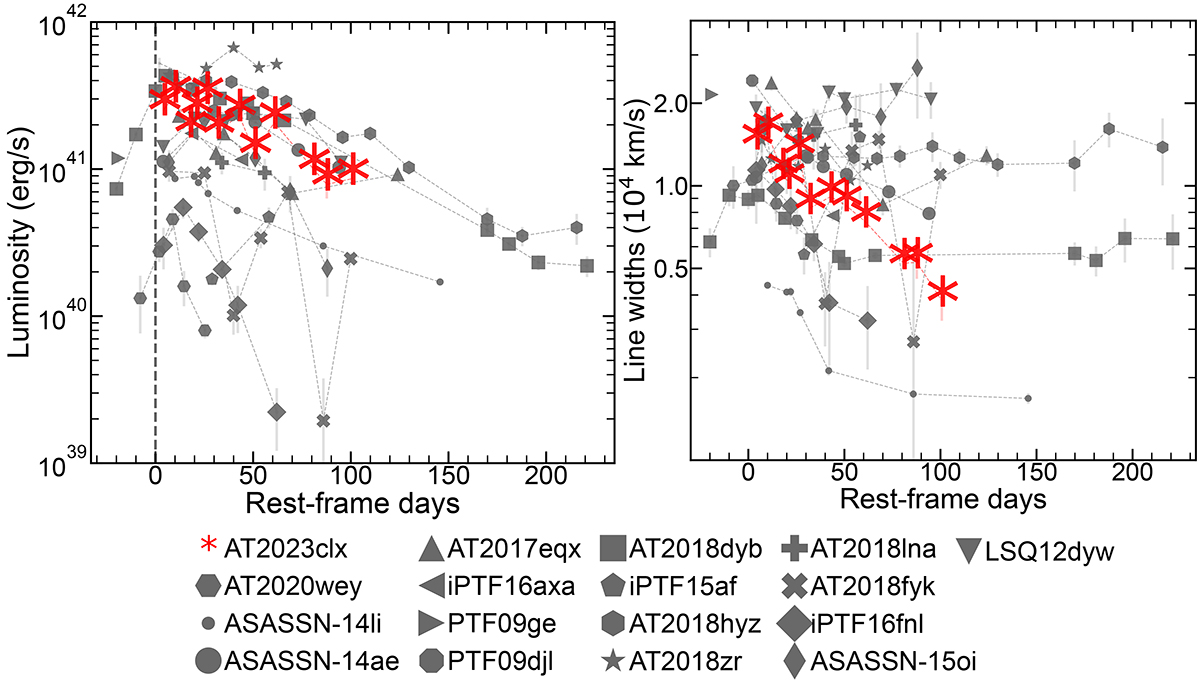
Fig. B.7.
Download original image
Hα properties as a function of time. Left panel: Hα luminosity evolution of AT 2023clx as a function of time, compared with the sample of Charalampopoulos et al. (2022). The dashed vertical line denotes the time of peak or discovery of each TDE. Right panel: Hα line width evolution of AT 2023clx as a function of time, compared with the sample of Charalampopoulos et al. (2022).
Current usage metrics show cumulative count of Article Views (full-text article views including HTML views, PDF and ePub downloads, according to the available data) and Abstracts Views on Vision4Press platform.
Data correspond to usage on the plateform after 2015. The current usage metrics is available 48-96 hours after online publication and is updated daily on week days.
Initial download of the metrics may take a while.