Fig. 2.
Download original image
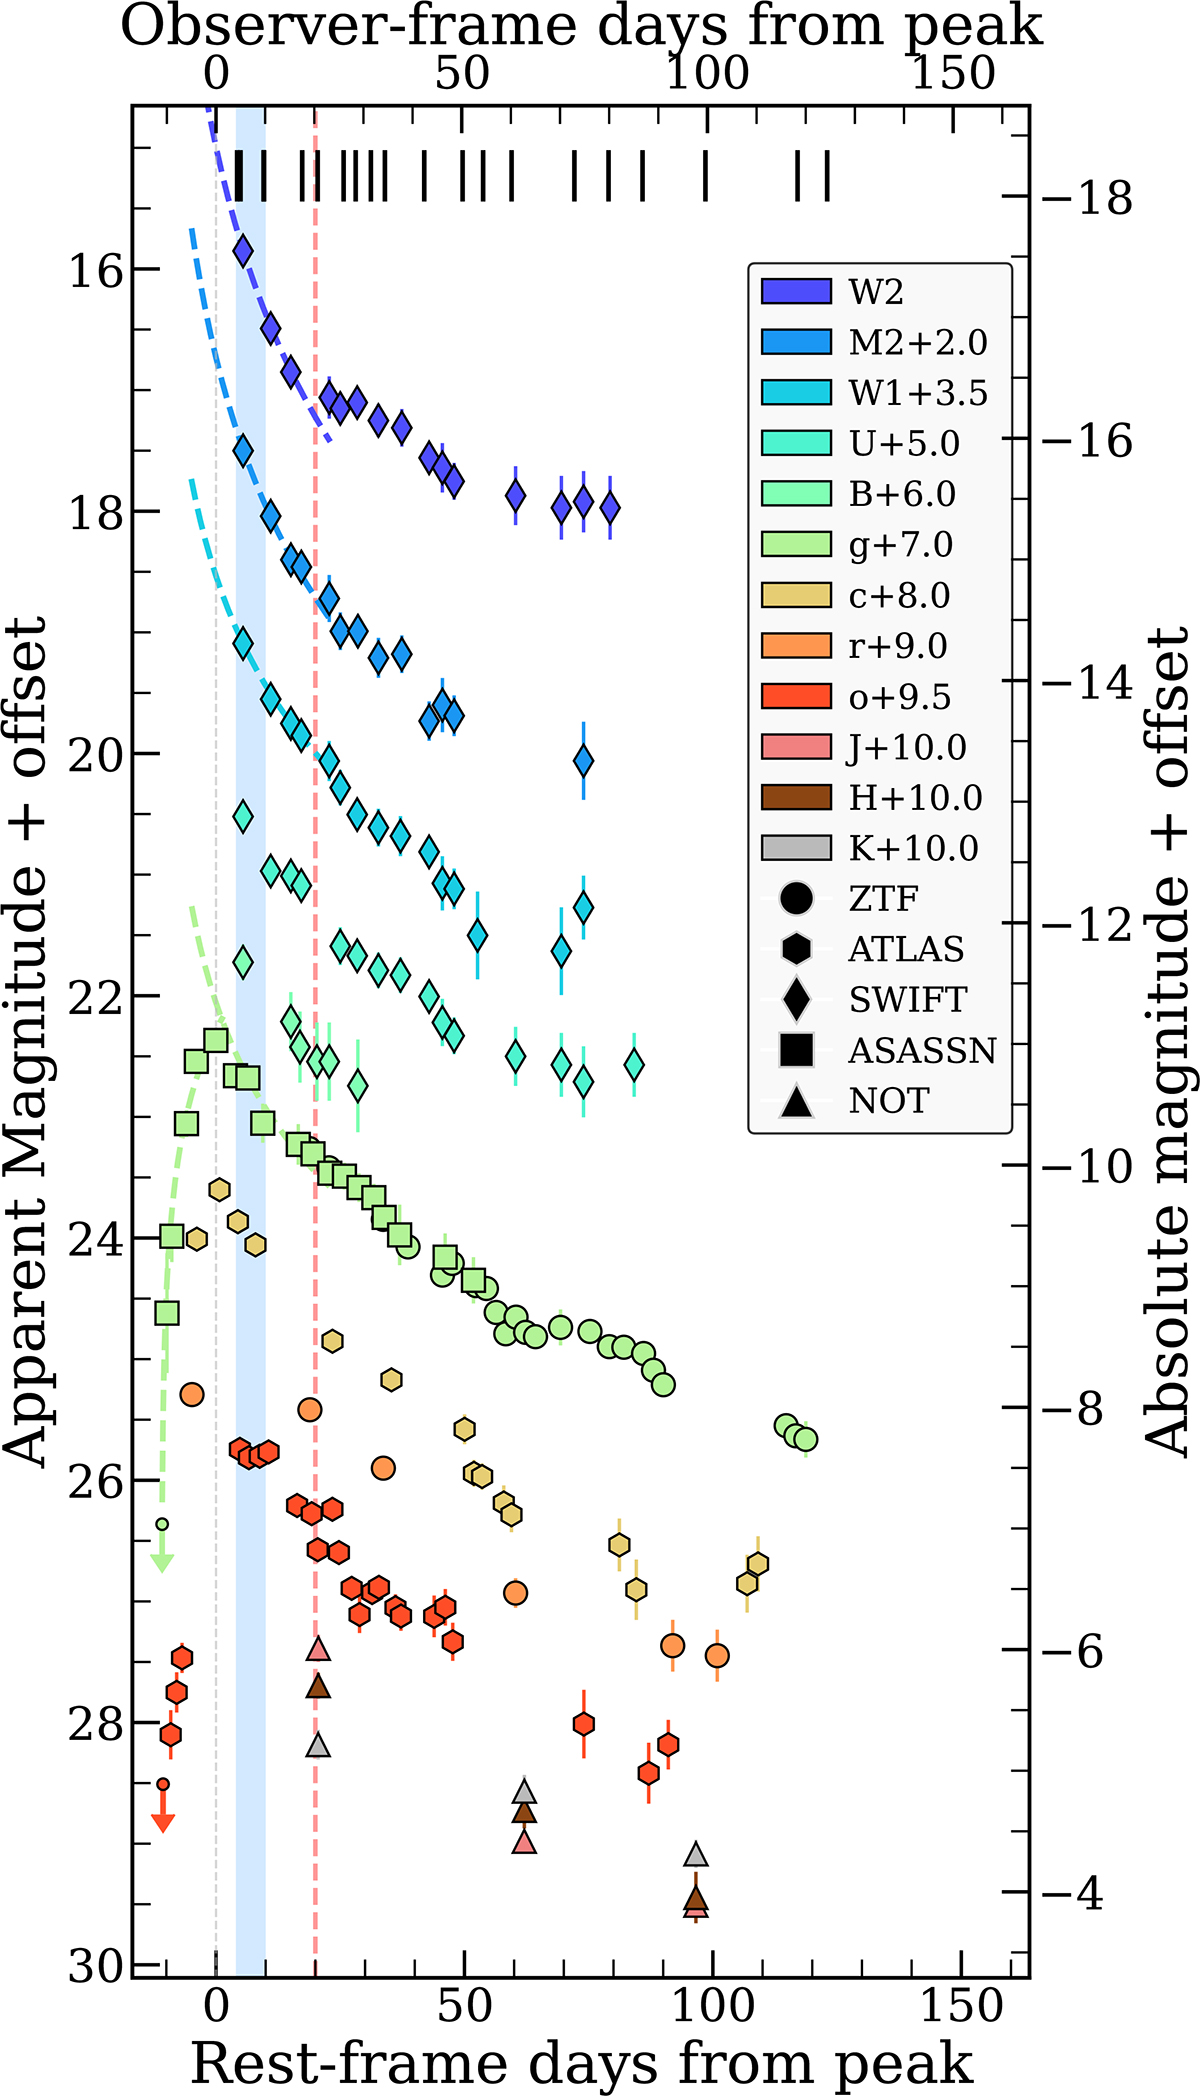
Host-subtracted and dereddened light curves of AT 2023clx. The peak epoch is constrained to MJD 59997.2 from fits to the g-band. The short black vertical bars denote the epochs when spectra were taken (Table 1). Non-detections are shown as small downward-facing arrows. The blue shaded region denotes the epochs during which the sharp, narrow emission feature at ∼6353 Å is present in the spectra. Power-law fits to the data over the first 20 days post-peak are shown for the UVW2, UVM2, UVW1, and g bands. For the latter, we also show a power-law fit to the rising part of the light curve. The red dashed vertical line denotes the end of the rapid cooling phase (see Fig. 3 and Sect. 5.3).
Current usage metrics show cumulative count of Article Views (full-text article views including HTML views, PDF and ePub downloads, according to the available data) and Abstracts Views on Vision4Press platform.
Data correspond to usage on the plateform after 2015. The current usage metrics is available 48-96 hours after online publication and is updated daily on week days.
Initial download of the metrics may take a while.