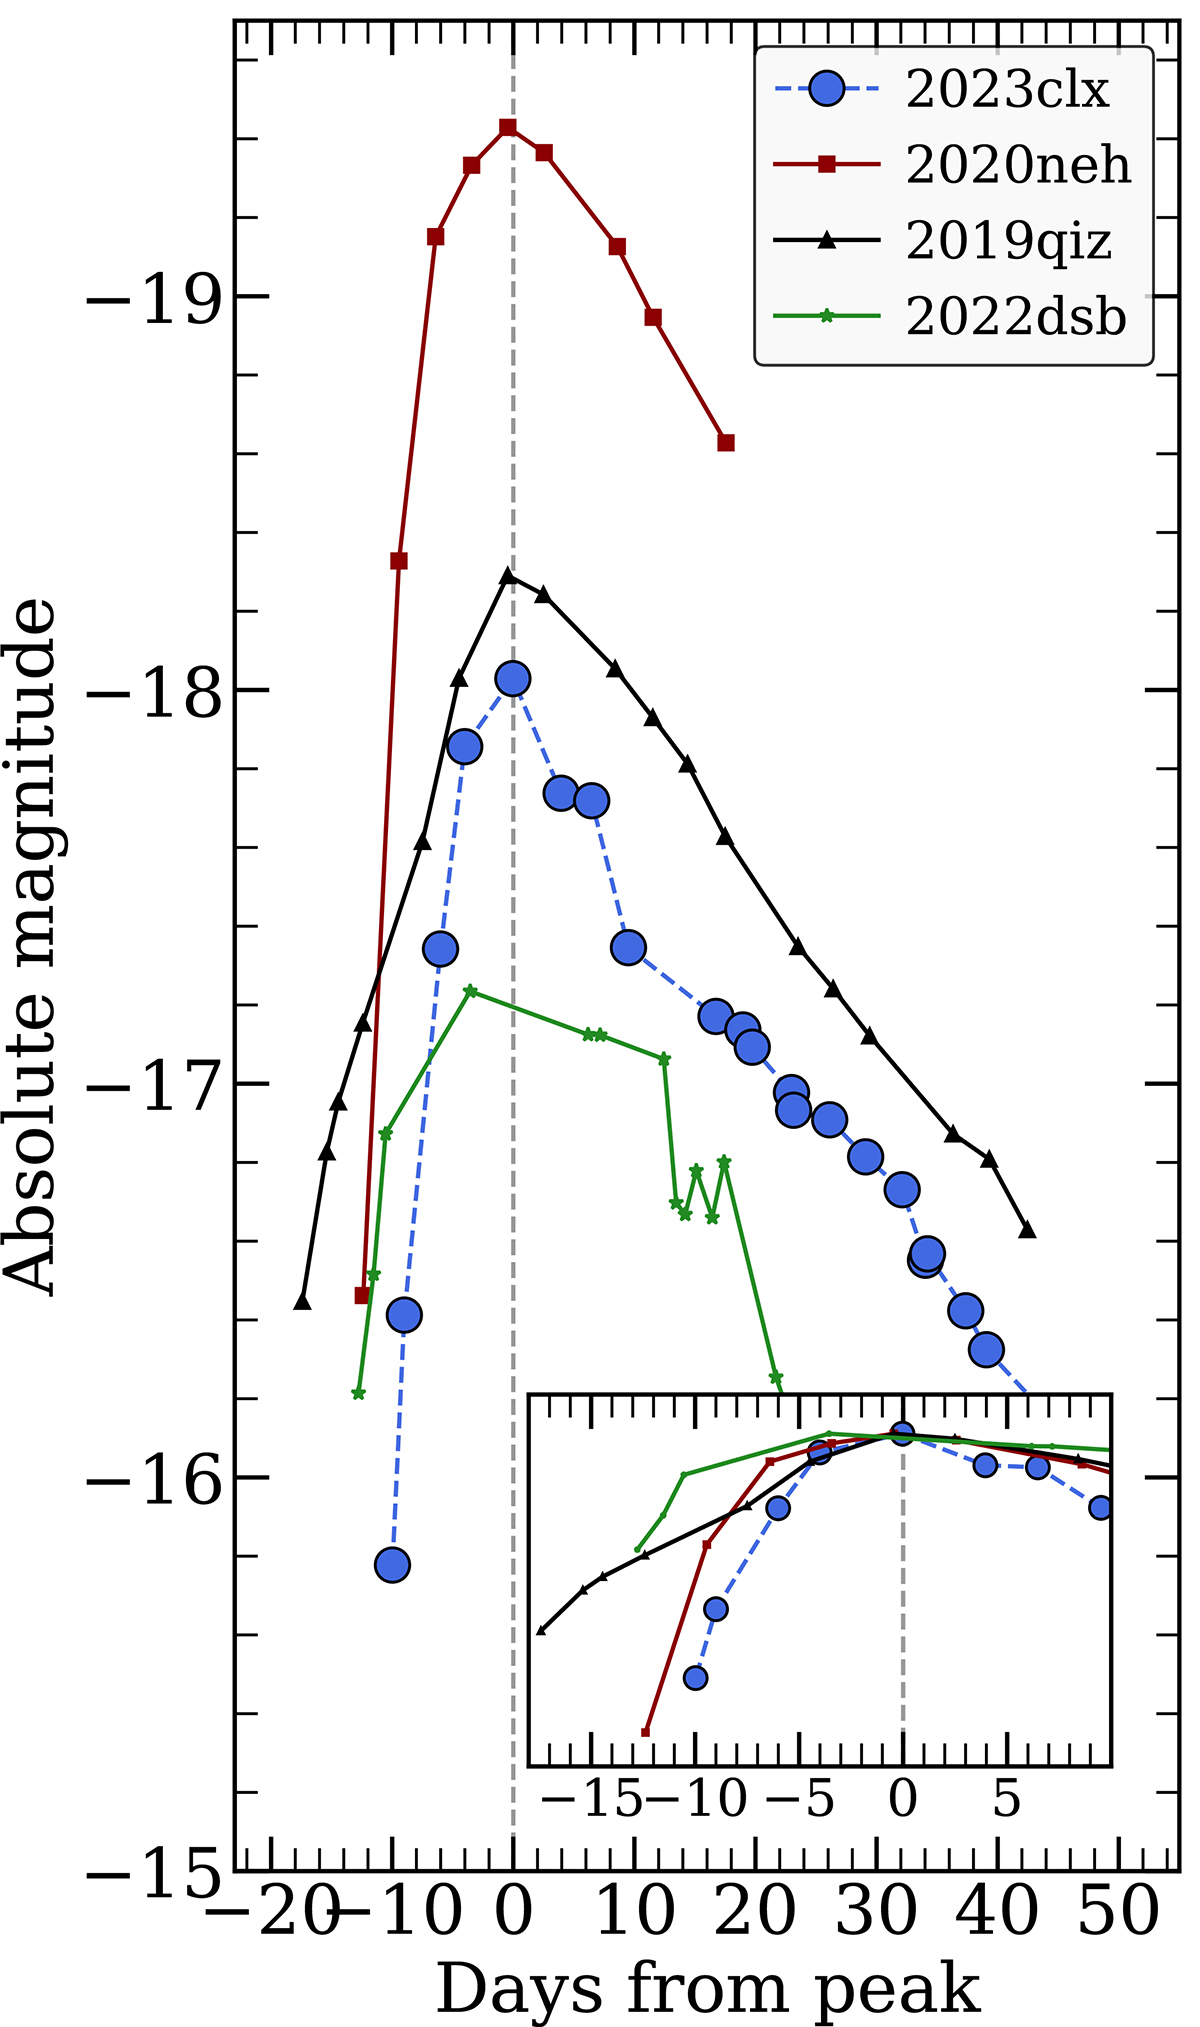
Fig. 13.
Download original image
Comparison of early g-band light curves of AT 2023clx, AT 2019qiz, AT 2022dsb (only ATLAS o-band available) and AT 2020neh, previously the fastest rising TDE to date. The peak epochs are taken from Nicholl et al. (2020), Malyali et al. (2024), and Angus et al. (2022) respectively. The inset shows the same data but normalised to peak light. AT 2023clx rises faster than all previously reported TDEs.
Current usage metrics show cumulative count of Article Views (full-text article views including HTML views, PDF and ePub downloads, according to the available data) and Abstracts Views on Vision4Press platform.
Data correspond to usage on the plateform after 2015. The current usage metrics is available 48-96 hours after online publication and is updated daily on week days.
Initial download of the metrics may take a while.