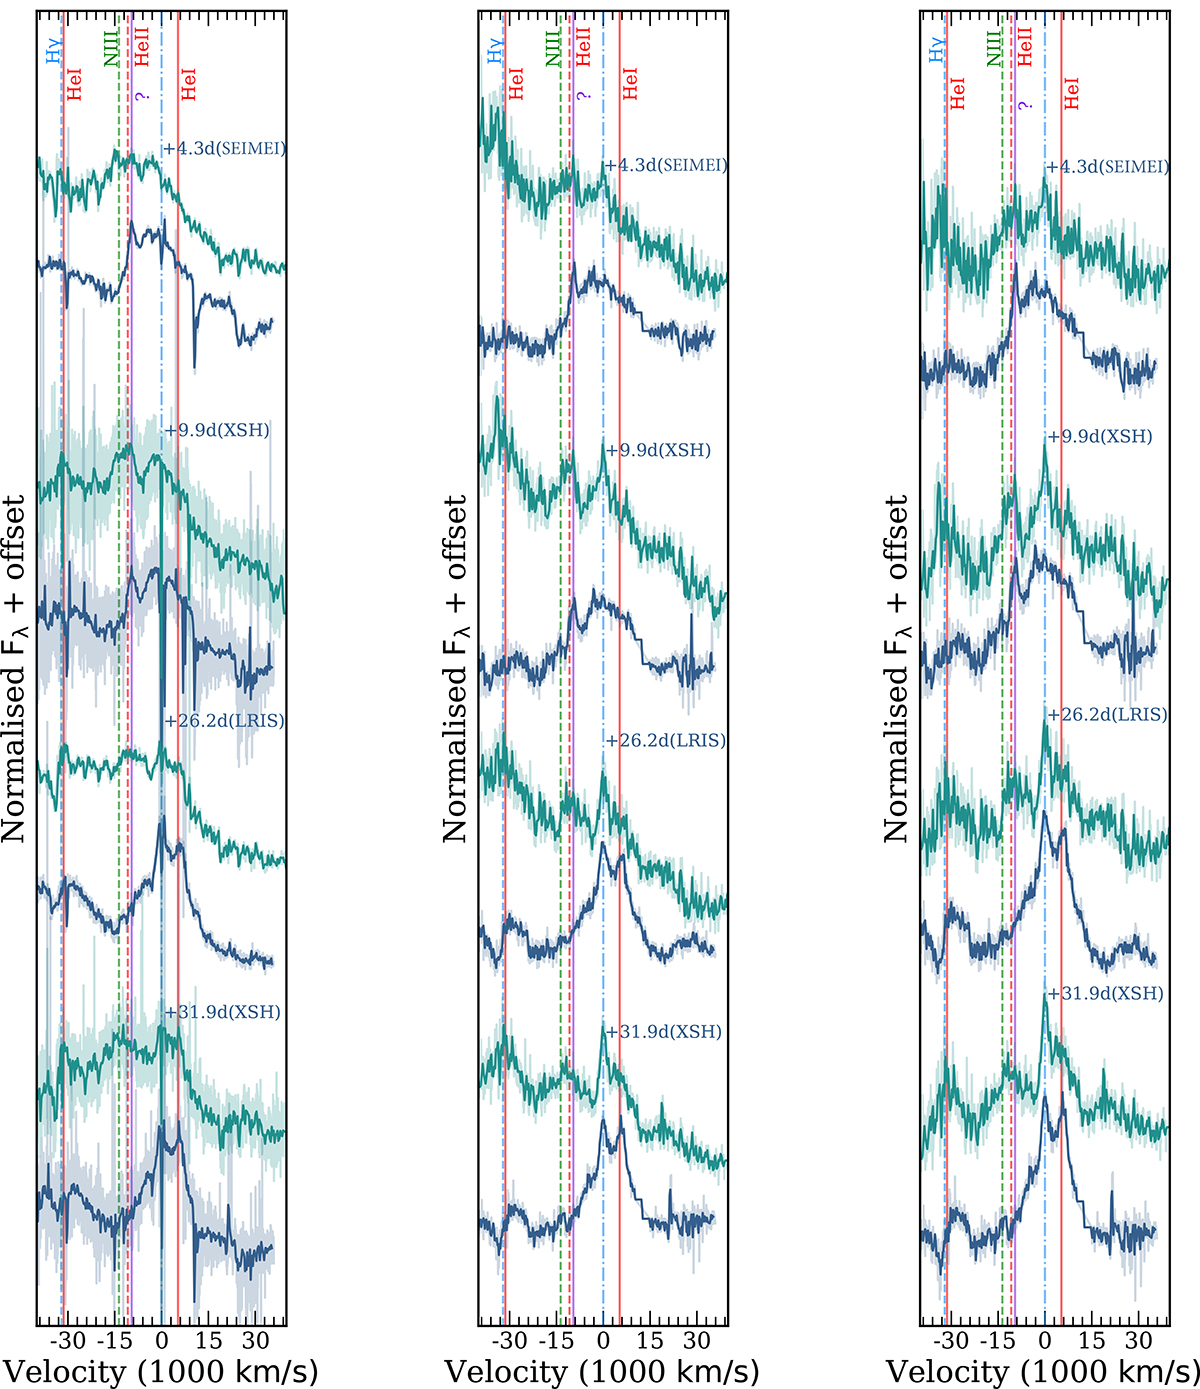
Fig. 11.
Download original image
Evolution of Hα (blue) and Hβ (green) region of the spectra in velocity space. Panel a: Before host subtraction. Panel b: Host subtracted. Panel c: Host subtracted and continuum subtracted. The dash-dotted vertical line shows the central wavelength. The colours of the vertical lines denote the different elements, blue is for hydrogen, red for helium, green for the N III and in purple we show the sharp feature at 6353 Å, present only until ∼ + 10 d post-peak. If this feature is a fast moving component connected to Hα, then its blueshift corresponds to ∼9600 km s−1. If Hβ has a similar component with the same velocity, it would appear at ∼4706 Å. A line is indeed seen in these wavelengths but could be associated with He II 4686 Å.
Current usage metrics show cumulative count of Article Views (full-text article views including HTML views, PDF and ePub downloads, according to the available data) and Abstracts Views on Vision4Press platform.
Data correspond to usage on the plateform after 2015. The current usage metrics is available 48-96 hours after online publication and is updated daily on week days.
Initial download of the metrics may take a while.