Open Access
Fig. 1
Download original image
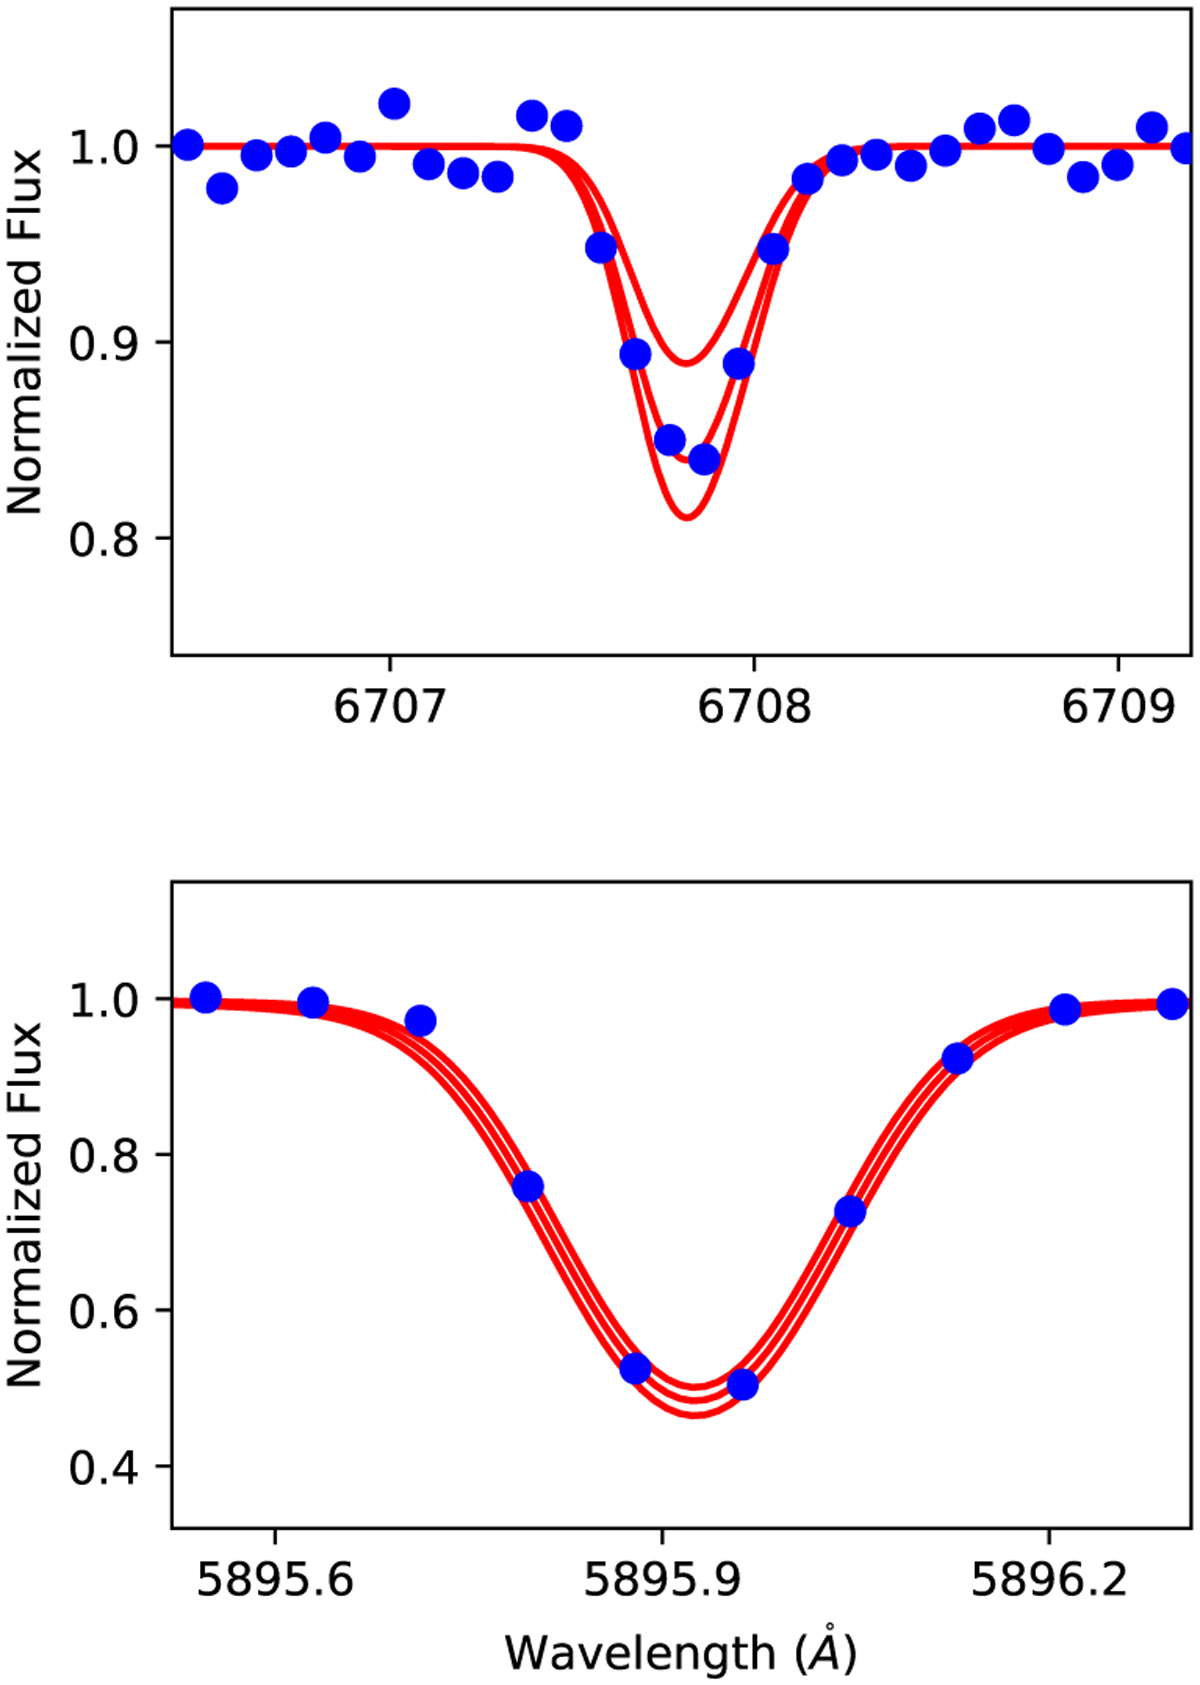
Spectral regions of MIKE spectrum (blue points) around the Li resonance line and a Na D line (upper and lower panel, respectively), with superimposed synthetic spectra calculated with the best-fit abun- dance (central red curve) and ±0.1 dex from the best-fit abundance.
Current usage metrics show cumulative count of Article Views (full-text article views including HTML views, PDF and ePub downloads, according to the available data) and Abstracts Views on Vision4Press platform.
Data correspond to usage on the plateform after 2015. The current usage metrics is available 48-96 hours after online publication and is updated daily on week days.
Initial download of the metrics may take a while.