Fig. 4.
Download original image
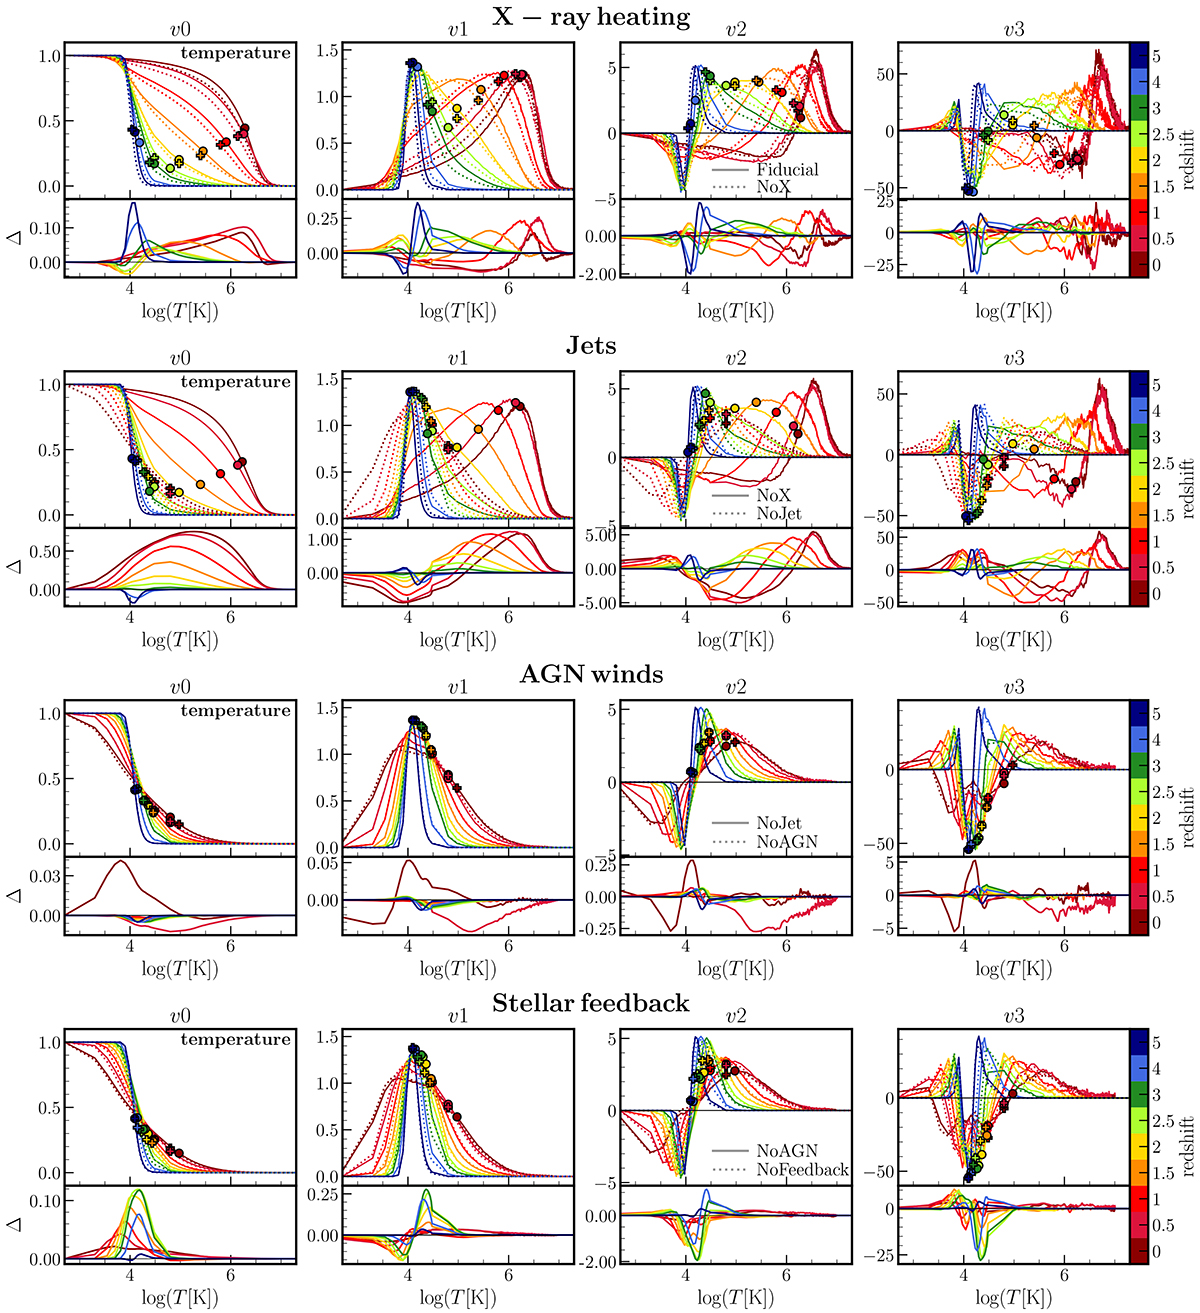
Temperature. Minkowski curves (columns) of gas temperature for different models (top to bottom) and redshift (colours). Each row shows a comparison of two models differing by one ingredient at a time (indicated in the plot titles), probing its impact on Minkowski functionals. In each row, the upper panel shows the two models (solid and dashed lines) and the bottom panel shows their differences, Δ. Filled coloured circles and plus symbols indicate the mean value of the field at each redshift for two models shown with solid and dashed lines, respectively. First row: Fiducial model is compared to the NoX, showing the effect of X-ray heating. Second row: NoX model is compared to NoJet, showing the effect of jets. Third row: NoJet model is compared to NoAGN, highlighting the effect of AGN winds. Fourth row: NoAGN model is compared to NoFeedback, showing the effect of stellar feedback. The morphology of the T-field is most strongly impacted by AGN jets at low redshift (z ≲ 2), but also by the X-ray heating at both high (z ∼ 4 − 5) and low redshift (z ≲ 2 − 3), though to a somewhat lesser extent. Interestingly, the strongest impact of the stellar feedback (with a strength comparable to X-ray heating) is seen near the epoch of cosmic noon z ∼ 2 − 3.
Current usage metrics show cumulative count of Article Views (full-text article views including HTML views, PDF and ePub downloads, according to the available data) and Abstracts Views on Vision4Press platform.
Data correspond to usage on the plateform after 2015. The current usage metrics is available 48-96 hours after online publication and is updated daily on week days.
Initial download of the metrics may take a while.