Fig. D.1.
Download original image
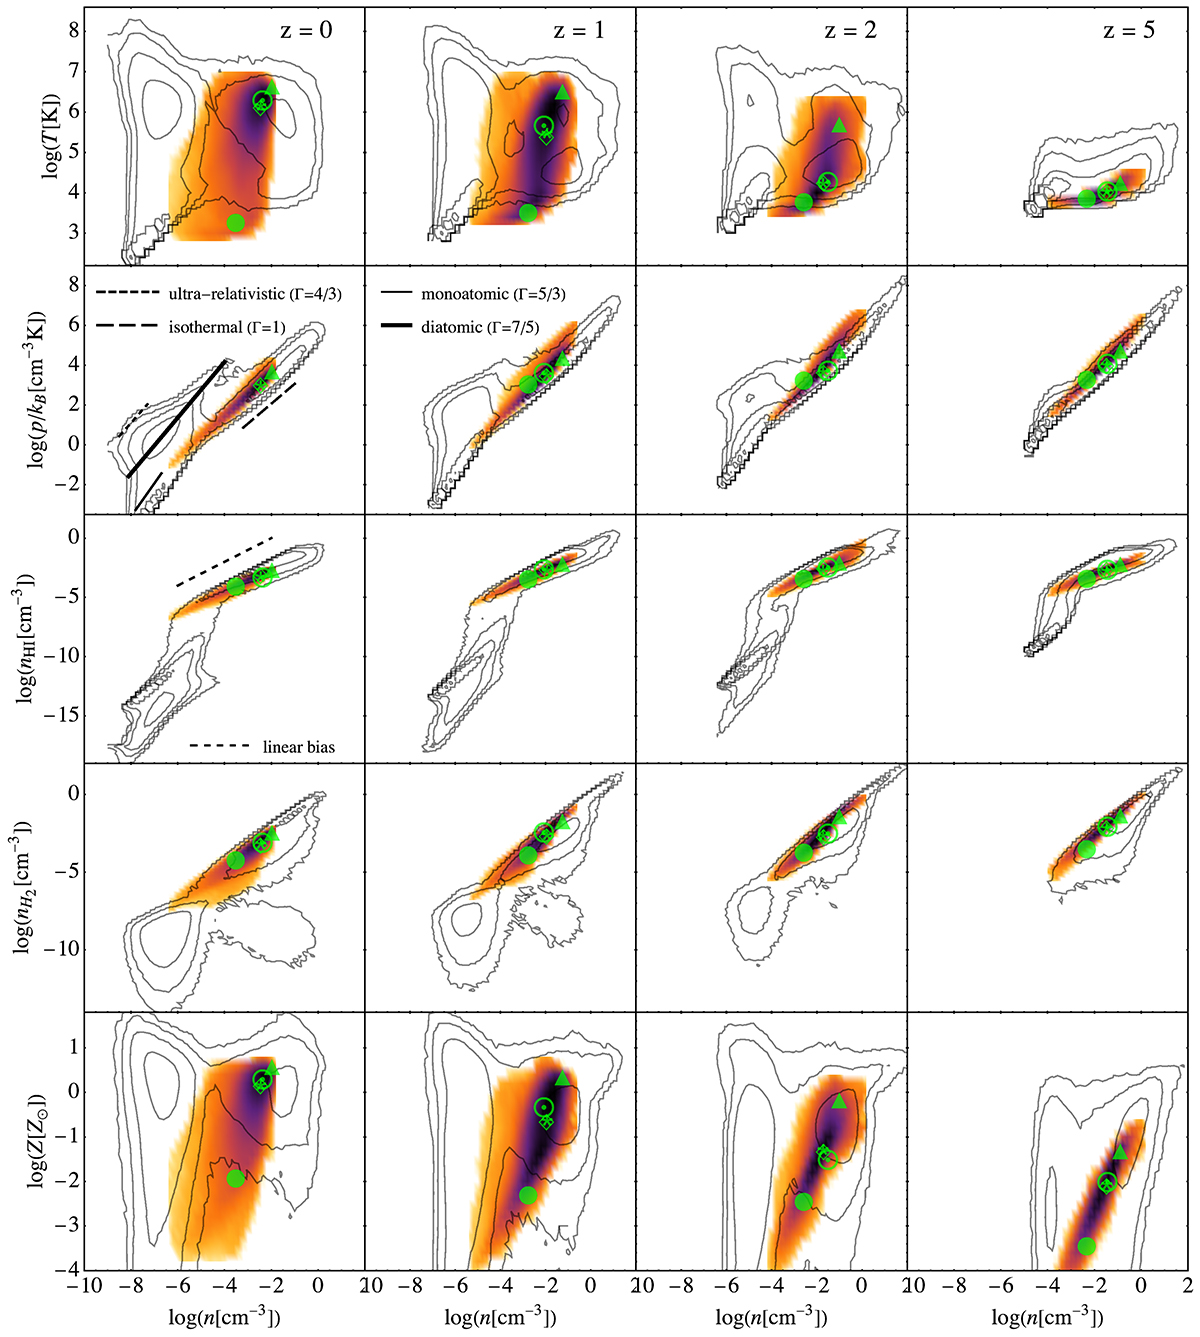
Phase diagrams for the Fiducial model at redshift z = 0, 1, 2, 5 for the original and smoothed fields (contours and density plot, respectively; lines and colours account for log-counts over five decades between 10 and 105). As a reference, some polytropic laws are superposed to the P − n diagram at z = 0 (see legend) and the linear bias relation is indicated on the nHI − n bivariate distribution at z = 0. Opaque symbols pinpoint threshold values where v0 = 0.5 (star), v2 = 0 (diamond), v3 is maximum (triangle), minimum (dot circle), and has a second global maximum (filled circle), illustrating the relationship between thermodynamical and chemical states, possibly described by some scaling relation, and the average morphology of the corresponding excursion-set.
Current usage metrics show cumulative count of Article Views (full-text article views including HTML views, PDF and ePub downloads, according to the available data) and Abstracts Views on Vision4Press platform.
Data correspond to usage on the plateform after 2015. The current usage metrics is available 48-96 hours after online publication and is updated daily on week days.
Initial download of the metrics may take a while.