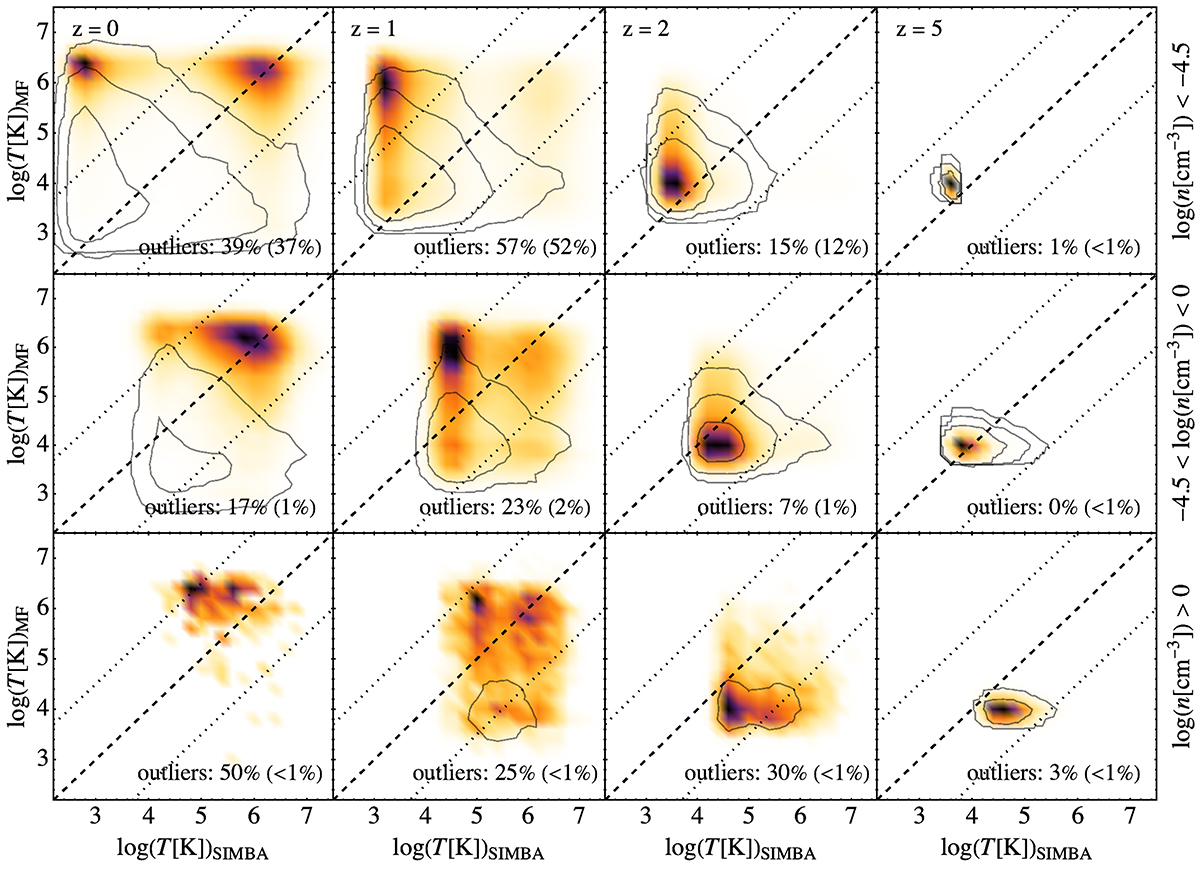
Fig. C.1.
Download original image
Scattering plot mapping the point-wise (cell) values of original SIMBA and smoothed temperature fields for the Fiducial and NoAGN models (colours and contours), as a function of redshift (left to right) and for three selections of the underlying original HI density field (top to bottom for low, mid, and high density; see legend). The fraction of outliers with |log TMF − log TSIMBA| > 1.5 is marked by dotted lines and indicated in each panel (in parenthesis, the fraction with respect to the full sample). Contours account for 100, 1 000, and 10 000 counts, not shown if sparse.
Current usage metrics show cumulative count of Article Views (full-text article views including HTML views, PDF and ePub downloads, according to the available data) and Abstracts Views on Vision4Press platform.
Data correspond to usage on the plateform after 2015. The current usage metrics is available 48-96 hours after online publication and is updated daily on week days.
Initial download of the metrics may take a while.