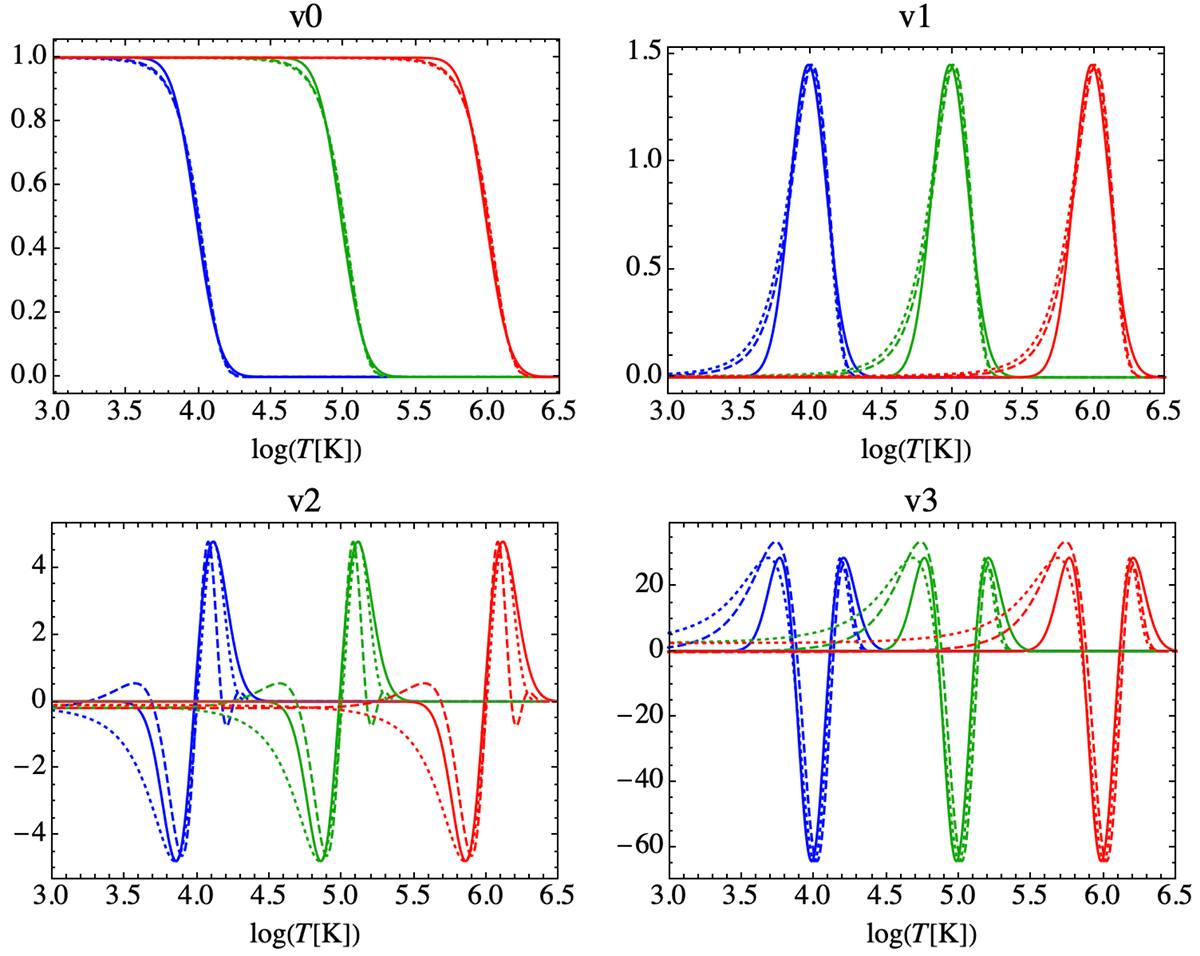
Fig. A.1.
Download original image
Examples of Minkowski curves of Gaussian, weakly non-Gaussian, and log-normal temperature random field (dotted, dashed, and solid lines, respectively) for three values of the mean temperature (T = 104 K, blue lines; T = 105 K, green; T = 106 K, red). The amplitude of the MFs of Gaussian and weakly non-Gaussian random fields are normalised to that of the LN random field; their apparent skewness is due to the logarithmic scale. For illustrative purpose, the parameters are fixed to σ0 = 0.3, (S0, S1, S2) = (0.2, 1, 0.1), λ = 25.
Current usage metrics show cumulative count of Article Views (full-text article views including HTML views, PDF and ePub downloads, according to the available data) and Abstracts Views on Vision4Press platform.
Data correspond to usage on the plateform after 2015. The current usage metrics is available 48-96 hours after online publication and is updated daily on week days.
Initial download of the metrics may take a while.