Fig. 10.
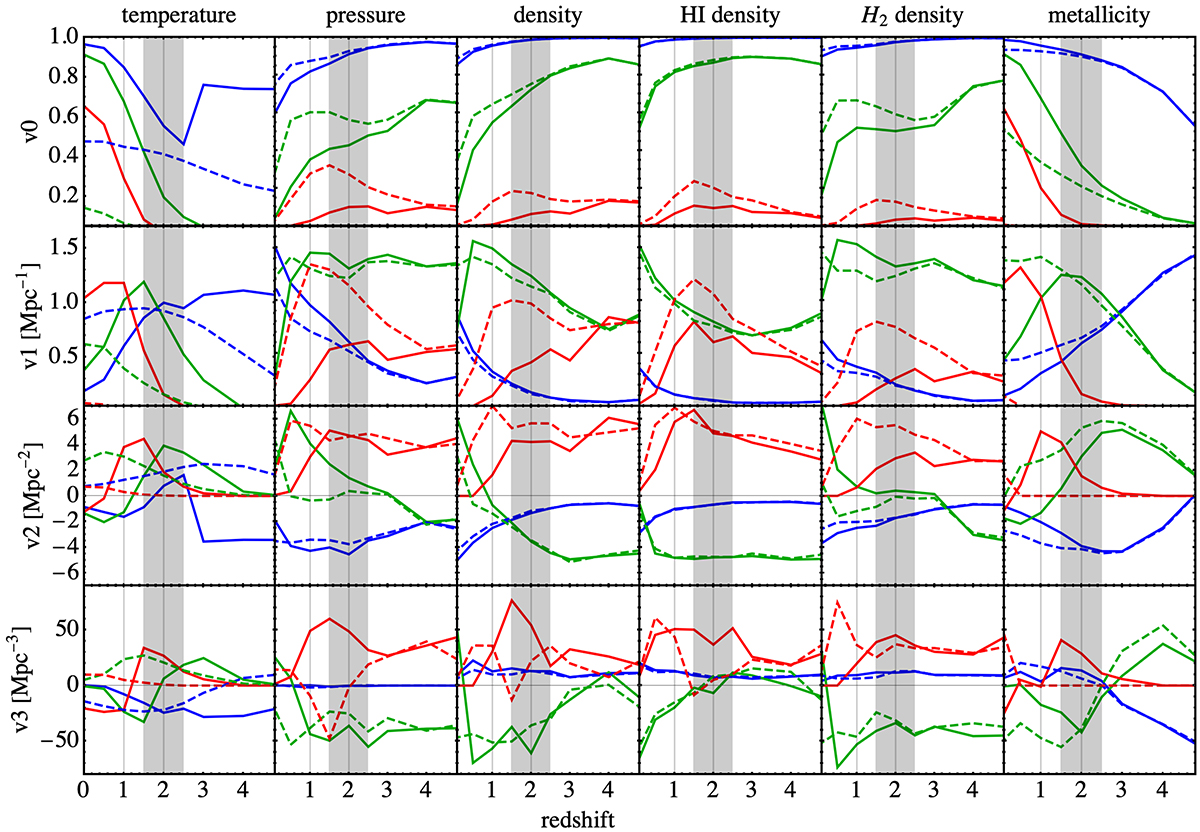
Download original image
Time evolution of MFs (top to bottom) for all the fields at three specific threshold values spanning the full range, for the Fiducial model (solid line) and for the NoAGN model (dashed line). Threshold values (blue, green, red in increasing order): log(T[K]) = {4, 5, 6}; log(P/kB[cm−3K]) = {3, 3.9, 4.8}; log(n[cm−3]) = { − 3, −2, −1}; log(nHI[cm−3]) = {−4,−3,−2}; log(nH2[cm−3]) = { − 4, −2.5, −1}; log(Z[Z⊙]) = { − 2, −1, 0}. The shaded band indicates the redshift range 1.5 < z < 2.5 around the peak of star formation rate density, which approximately coincides with the maximum of AGN luminosity function for AGN with bolometric luminosity 1045 < Lbol/(erg s−1) < 1046; vertical lines mark the maximum of the AGN luminosity function for AGN with 1044 < Lbol/(erg s−1) < 1045 (z ≃ 1) and 1046 < Lbol/(erg s−1) < 1048 (z ≃ 2). As discussed in Sect. 4.2, these curves display many distinct features depending on the captured feedback processes, supporting the informative value of the cosmic evolution of morphology (each feature likely encodes a specific signature of the underlying process).
Current usage metrics show cumulative count of Article Views (full-text article views including HTML views, PDF and ePub downloads, according to the available data) and Abstracts Views on Vision4Press platform.
Data correspond to usage on the plateform after 2015. The current usage metrics is available 48-96 hours after online publication and is updated daily on week days.
Initial download of the metrics may take a while.