Fig. 9.
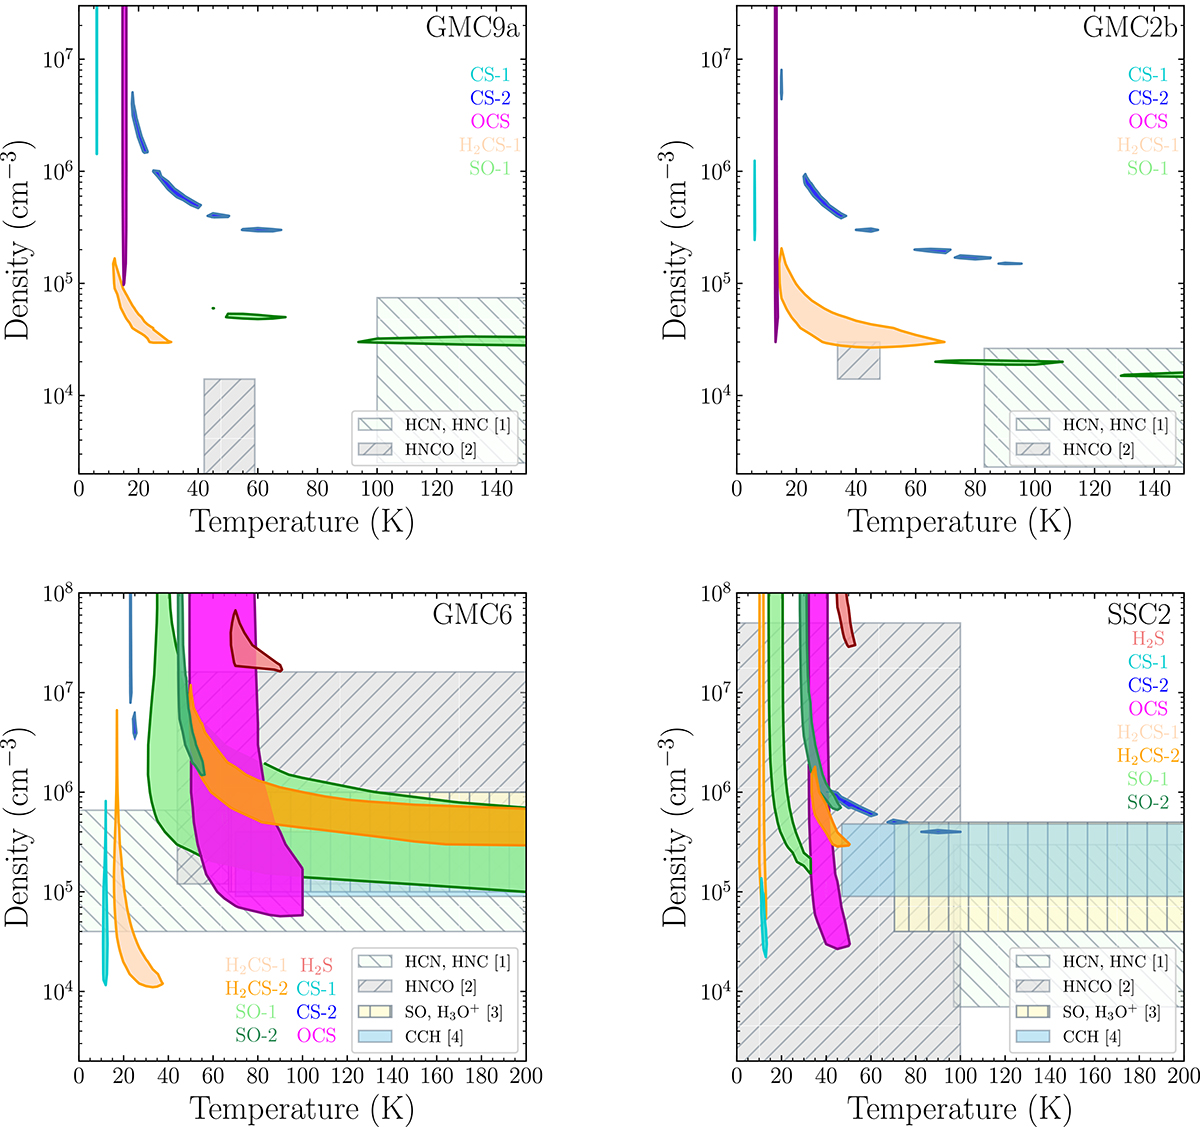
Download original image
Density and temperature contour plots derived from the LVG analysis for representative regions in the outer CMZ (GMC9a and GMC2b) and for the inner CMZ ( GMC6 and SSC2). The contours show the 1σ solutions obtained for the minimum value of the χ2 in the column density parameter derived for each species (and components) and region. Derived gas density and parameters for other species (HCN, HNC; HNCO; SO, H3O+; CCH) studied in previous ALCHEMI studies were plotted for comparison: [1] Behrens et al. (2022), [2] Huang et al. (2023), [3] Holdship et al. (2022), [4] Holdship et al. (2021).
Current usage metrics show cumulative count of Article Views (full-text article views including HTML views, PDF and ePub downloads, according to the available data) and Abstracts Views on Vision4Press platform.
Data correspond to usage on the plateform after 2015. The current usage metrics is available 48-96 hours after online publication and is updated daily on week days.
Initial download of the metrics may take a while.