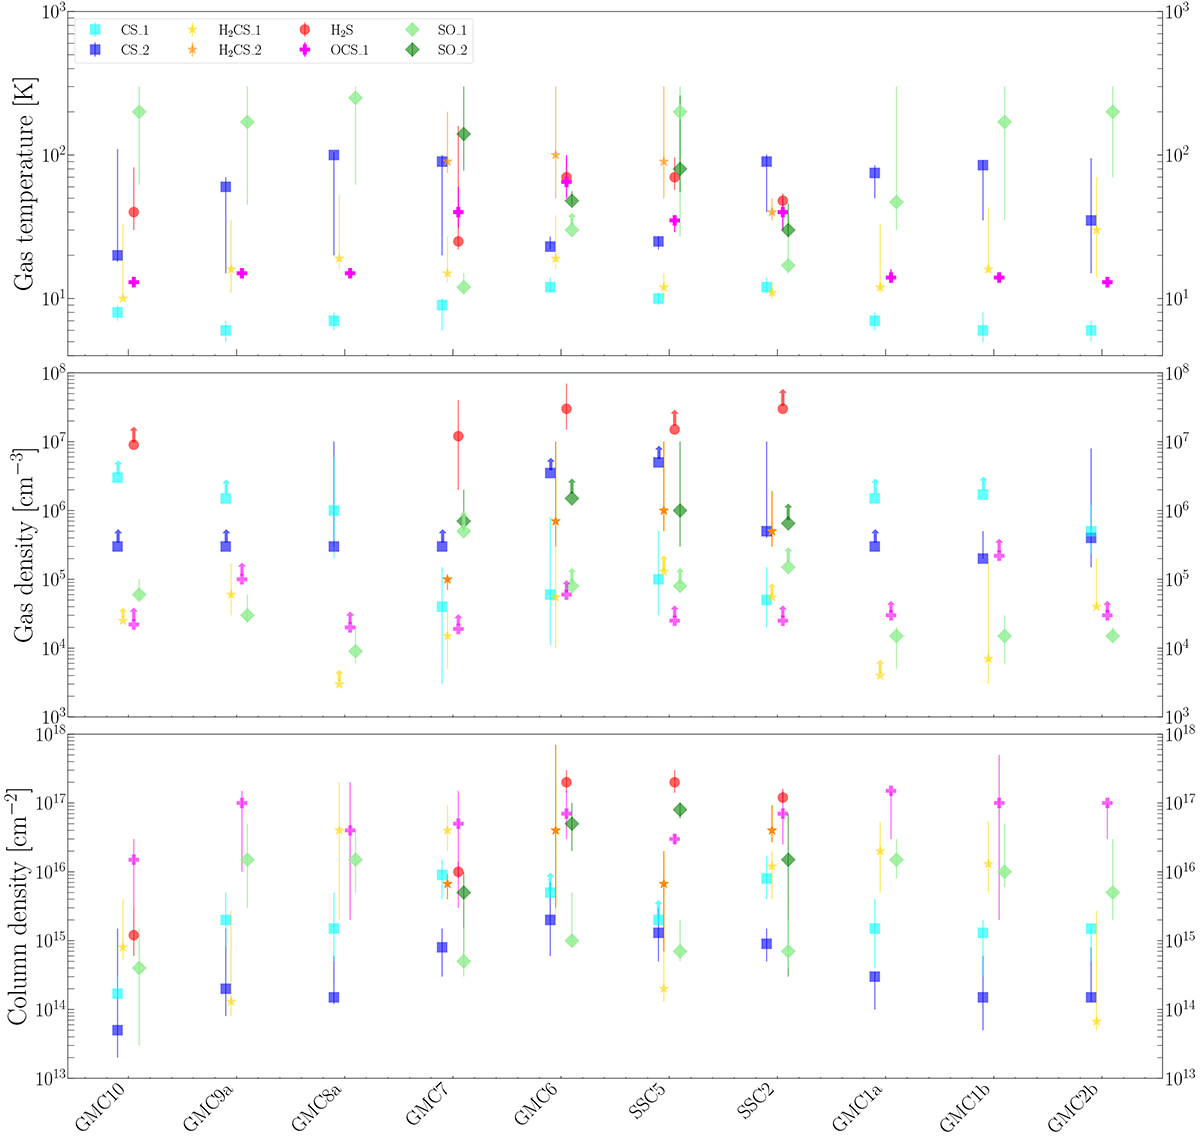
Fig. 8.
Download original image
Results of the LVG analysis for CS (square markers), H2CS (starred markers), H2S (circle marker), OCS (crossed marker), and SO (diamond marker) as a function of the regions. The first and second components for CS, H2CS, OCS, and SO are labelled “_1” and “_2”, respectively. Lower limits are indicated by upward arrows. The listed sequence of clouds follows the layout of the GMCs of the CMZ as shown in Figs. 1–3. From top to bottom, the results for the gas temperature, gas density, and column densities, are shown.
Current usage metrics show cumulative count of Article Views (full-text article views including HTML views, PDF and ePub downloads, according to the available data) and Abstracts Views on Vision4Press platform.
Data correspond to usage on the plateform after 2015. The current usage metrics is available 48-96 hours after online publication and is updated daily on week days.
Initial download of the metrics may take a while.